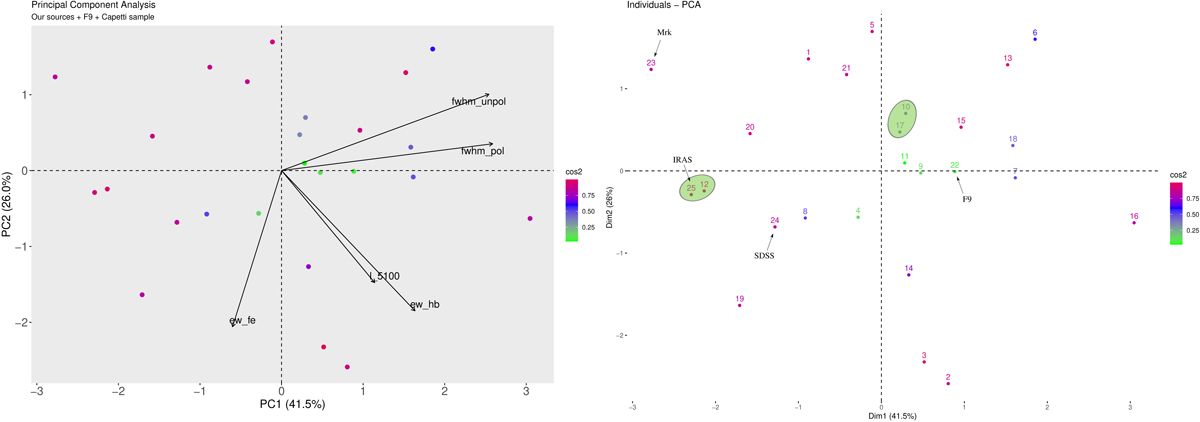
Fig. 12.
Download original image
Two-dimensional projections of the first two principal components (PCs) using the PCA for the sources shown in Table 9 after filtering out the sources marked with an asterisk. Only direct observables from the spectra were used in the PCA, namely, the AGN luminosity at 5100 Å (L5100 Å, in units of erg s−1), the FWHM of the polarized and unpolarized Hα emission line (in units of km s−1), and the EW for the corresponding Hβ and optical Fe II emission within 4434−4684 Å (in units of Å). The percentages reported in parenthesis mark the contribution of the respective PC to the overall variance in the data. The importance of the direct observables to each PC is shown using vectors. The sources are color coded according to their “squared cosine” values and are a function of the squared distance of the observation to the origin. The sources are numbered as in Table 9. The location of our three sources (Mrk 1044, SDSS J080101.41+184840.7, and, IRAS 04416+1215) and Fairall 9 are indicated. The two mini-clusters containing pairs of sources that were revealed from our clustering selection are shown with green shaded ovals. The clustering selection was based on the geometrical distance between two data points, δr ≲ 0.57, across all the projections.
Current usage metrics show cumulative count of Article Views (full-text article views including HTML views, PDF and ePub downloads, according to the available data) and Abstracts Views on Vision4Press platform.
Data correspond to usage on the plateform after 2015. The current usage metrics is available 48-96 hours after online publication and is updated daily on week days.
Initial download of the metrics may take a while.