Fig. 11.
Download original image
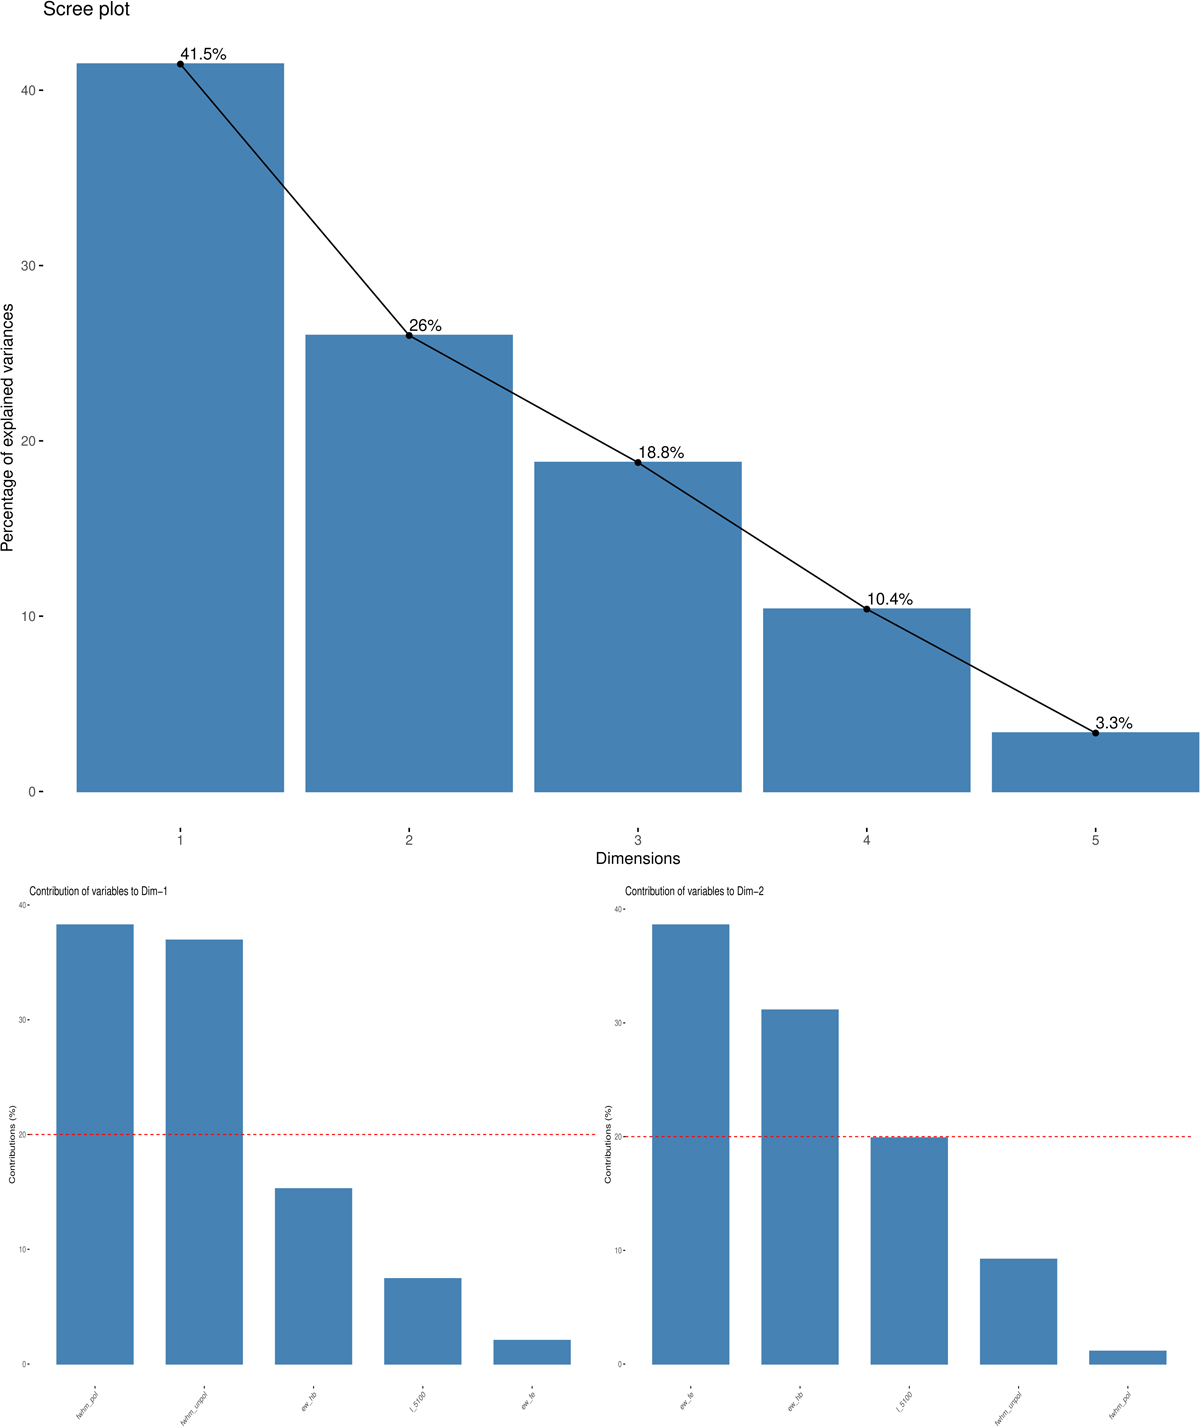
Contribution of principal components. Top panel: scree plot using the PCA and showing the contribution (as a percentage) of the five principal components (PCs) to the overall variance in the dataset. Bottom panels: contributions of the original variables: the AGN luminosity at 5100 Å (L5100 Å, in units of erg s−1); the FWHM of the polarized and unpolarized Hα emission line (in units of km s−1); and the EW for the corresponding Hβ and optical Fe II emission within 4434−4684 Å (in units of Å) to the first two PCs. The red dashed line indicates the expected average contribution.
Current usage metrics show cumulative count of Article Views (full-text article views including HTML views, PDF and ePub downloads, according to the available data) and Abstracts Views on Vision4Press platform.
Data correspond to usage on the plateform after 2015. The current usage metrics is available 48-96 hours after online publication and is updated daily on week days.
Initial download of the metrics may take a while.