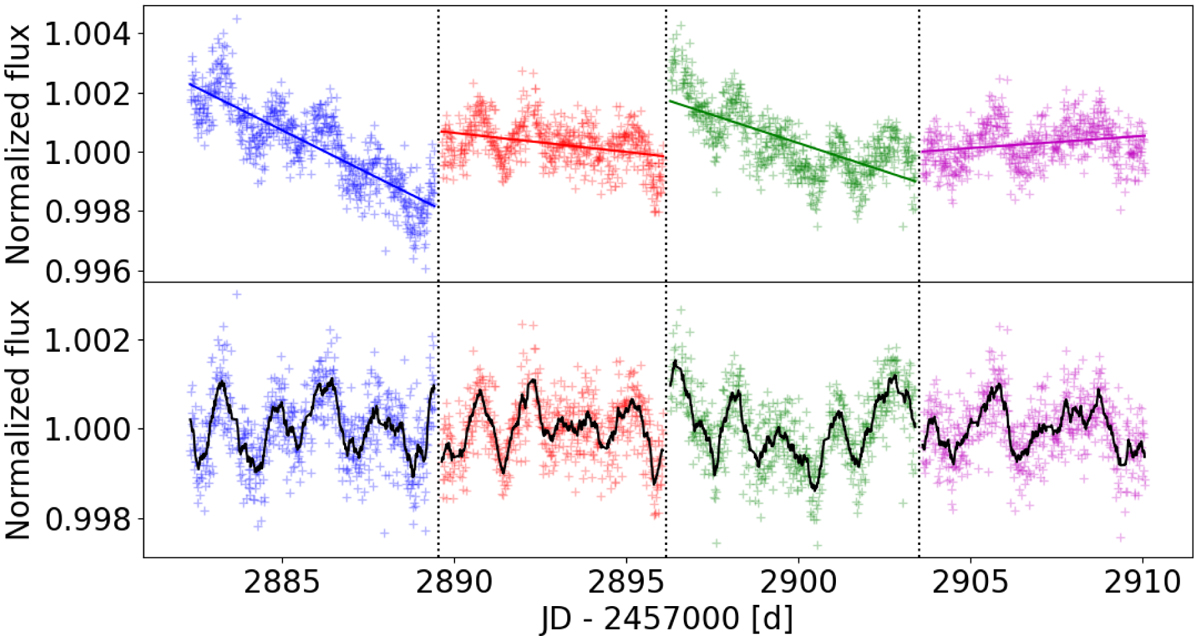
Fig. 1.
Download original image
TESS light curve of HAT-P-32. Top: median-normalized TESS light curve of HAT-P-32 without primary transits binned at 14 min cadence. Solid lines indicate best-fit linear models. Bottom: light curve normalized by linear models along with smoothed curve (solid black). In both panels, the colors of the data# points indicate the individual sections and the vertical lines highlight the separations between the sections.
Current usage metrics show cumulative count of Article Views (full-text article views including HTML views, PDF and ePub downloads, according to the available data) and Abstracts Views on Vision4Press platform.
Data correspond to usage on the plateform after 2015. The current usage metrics is available 48-96 hours after online publication and is updated daily on week days.
Initial download of the metrics may take a while.