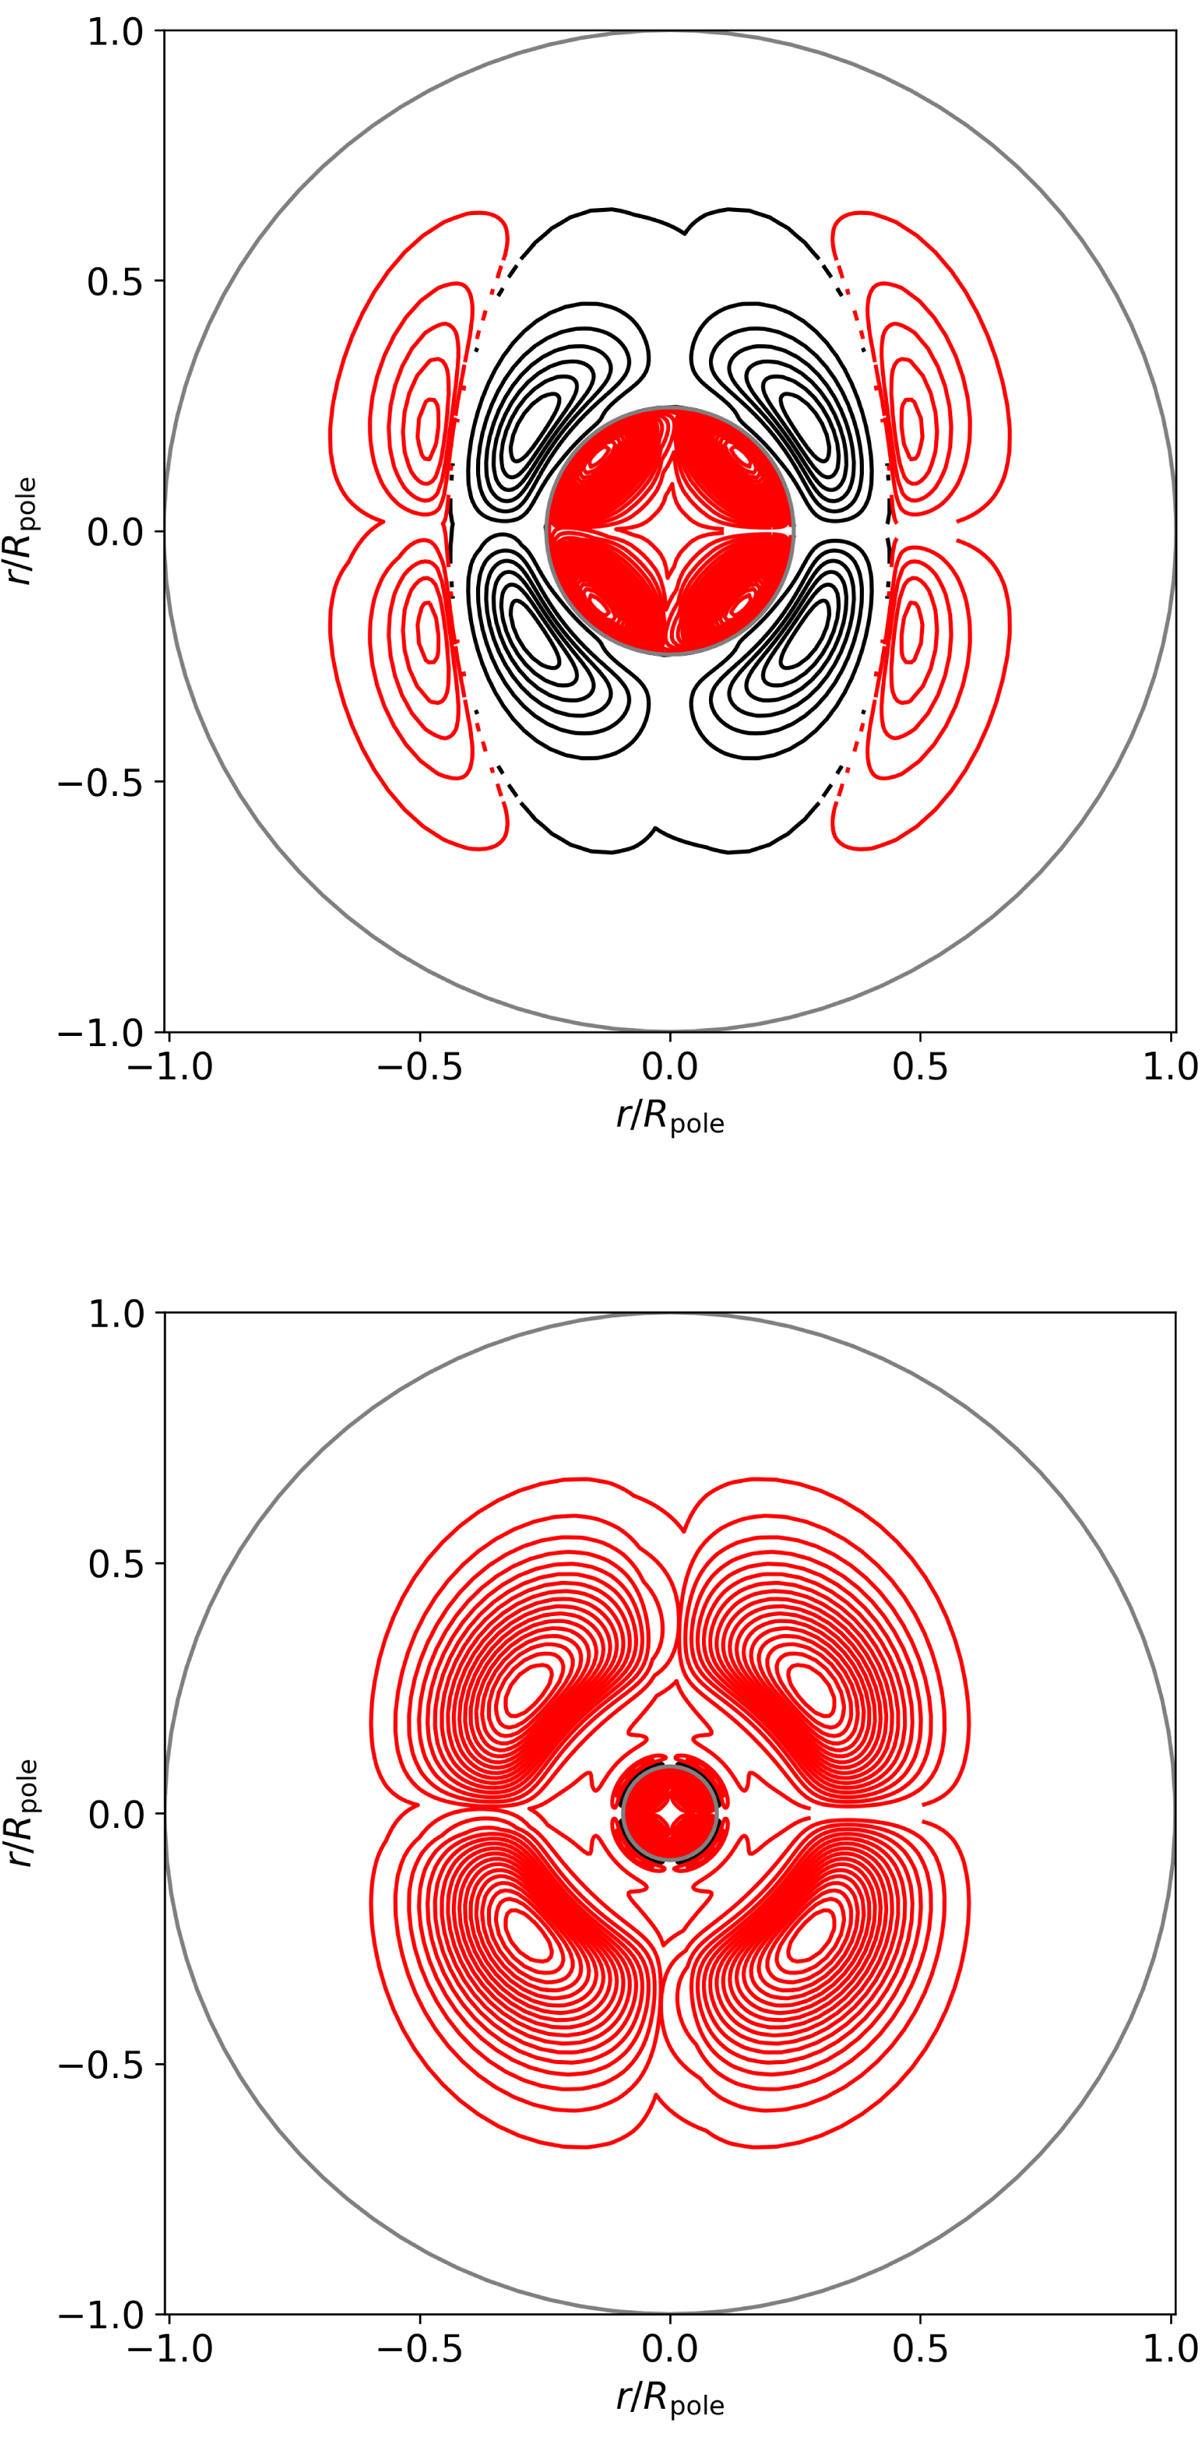
Fig. E.1.
Download original image
Isocontours of the stream function for model M1 of 1 Myr (top panel) and 15.75 Myr (bottom panel). The different colours indicate counter-rotating cells, where the red cells rotate clockwise in the first quadrant of the plot. These models correspond to those shown in Fig. 2. The isobars at the edge of the convective core and at the surface are shown in grey.
Current usage metrics show cumulative count of Article Views (full-text article views including HTML views, PDF and ePub downloads, according to the available data) and Abstracts Views on Vision4Press platform.
Data correspond to usage on the plateform after 2015. The current usage metrics is available 48-96 hours after online publication and is updated daily on week days.
Initial download of the metrics may take a while.