Fig. B.1.
Download original image
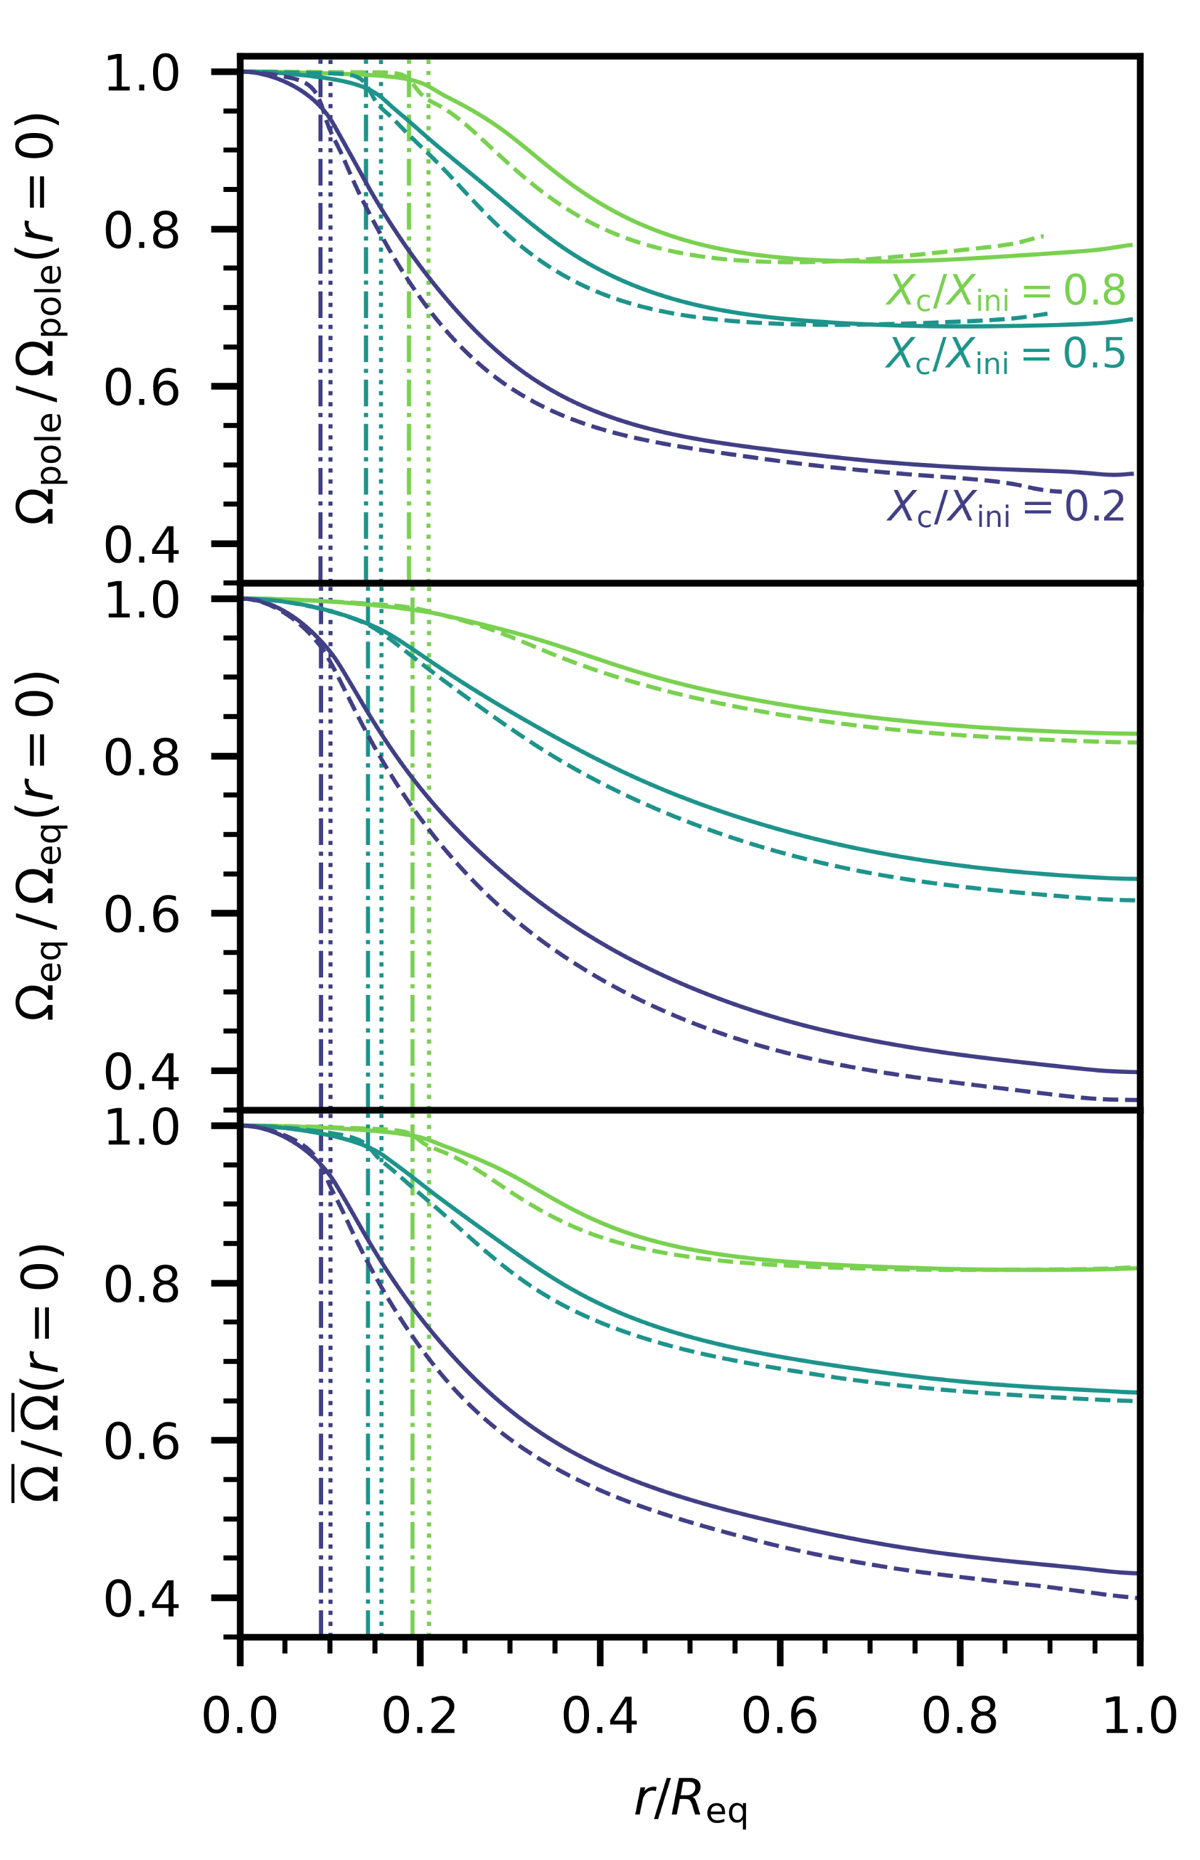
Profiles of the angular velocity as a function of the radial coordinate in the polar direction (top panel), equatorial direction (middle panel), and averaged over latitude (bottom panel). The solid lines correspond to model M1, the dashed lines to model M2. The locations of the outer edge of the convective core are shown as vertical lines (dotted lines for model M1, dashed-dotted for model M2).
Current usage metrics show cumulative count of Article Views (full-text article views including HTML views, PDF and ePub downloads, according to the available data) and Abstracts Views on Vision4Press platform.
Data correspond to usage on the plateform after 2015. The current usage metrics is available 48-96 hours after online publication and is updated daily on week days.
Initial download of the metrics may take a while.