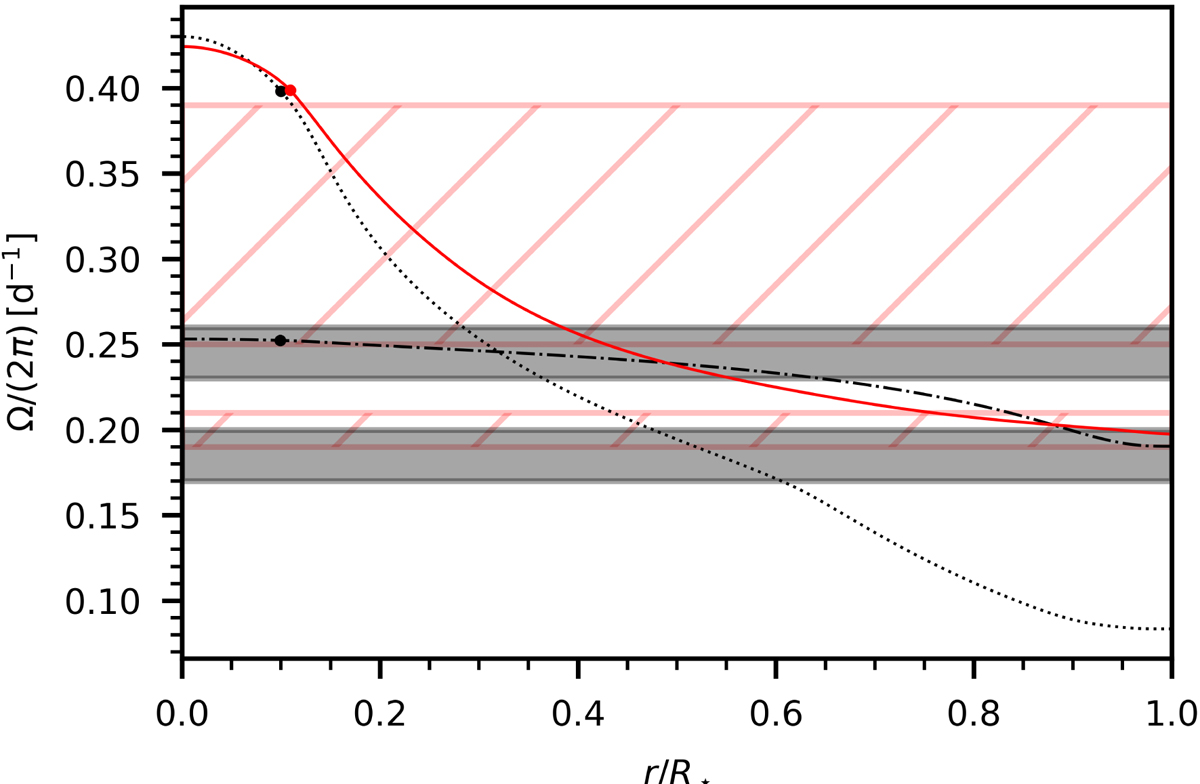
Fig. 5.
Download original image
Predicted rotation profile of HD 192575 with ESTER (red solid line) and MESA (black lines). The profiles indicated by a solid line and dotted line are for a constant viscosity of 107 cm2 s−1, while the dashed line is for 109 cm2 s−1. The dots correspond to the location of the core boundary. The red and grey shaded areas indicate the measured core (top one) and surface (bottom one) rotation frequencies by Burssens et al. (2023), assuming rshear equal to the outer boundary of the μ-gradient zone, and rshear = R⋆, respectively.
Current usage metrics show cumulative count of Article Views (full-text article views including HTML views, PDF and ePub downloads, according to the available data) and Abstracts Views on Vision4Press platform.
Data correspond to usage on the plateform after 2015. The current usage metrics is available 48-96 hours after online publication and is updated daily on week days.
Initial download of the metrics may take a while.