Fig. 4.
Download original image
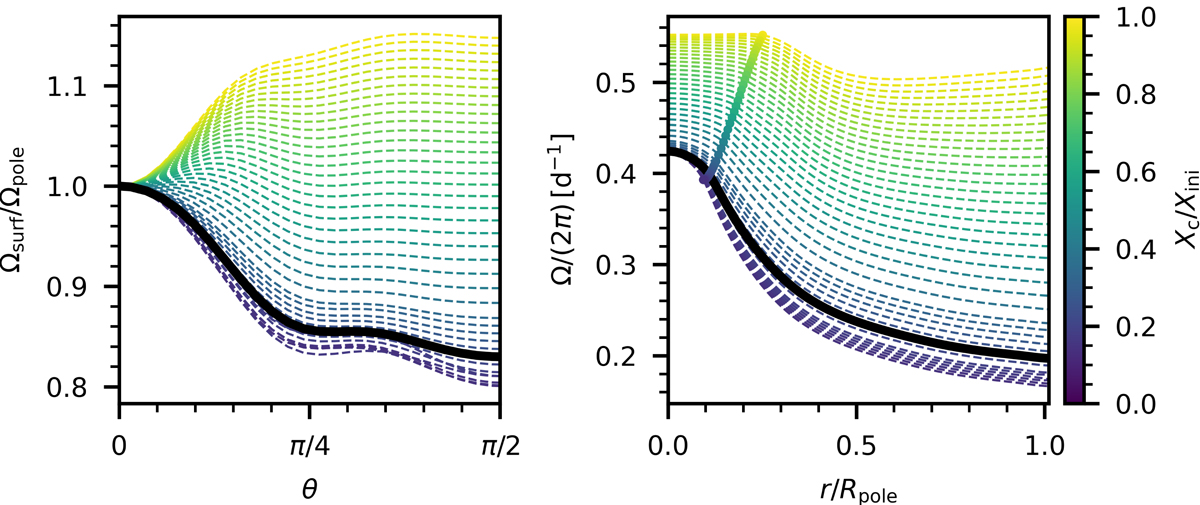
Evolution of the rotation profile of model M1. Left panel: predicted surface rotation as a function of colatitude throughout the evolution (indicated by colour) normalised by the rotation frequency at the pole. Right panel: profile of the angular velocity (averaged over θ) throughout the evolution. The thick coloured line indicates the location of the convective core boundary. The black lines in both panels correspond to the best-matching model for HD 192575 (last column in Table 1).
Current usage metrics show cumulative count of Article Views (full-text article views including HTML views, PDF and ePub downloads, according to the available data) and Abstracts Views on Vision4Press platform.
Data correspond to usage on the plateform after 2015. The current usage metrics is available 48-96 hours after online publication and is updated daily on week days.
Initial download of the metrics may take a while.