Fig. 1.
Download original image
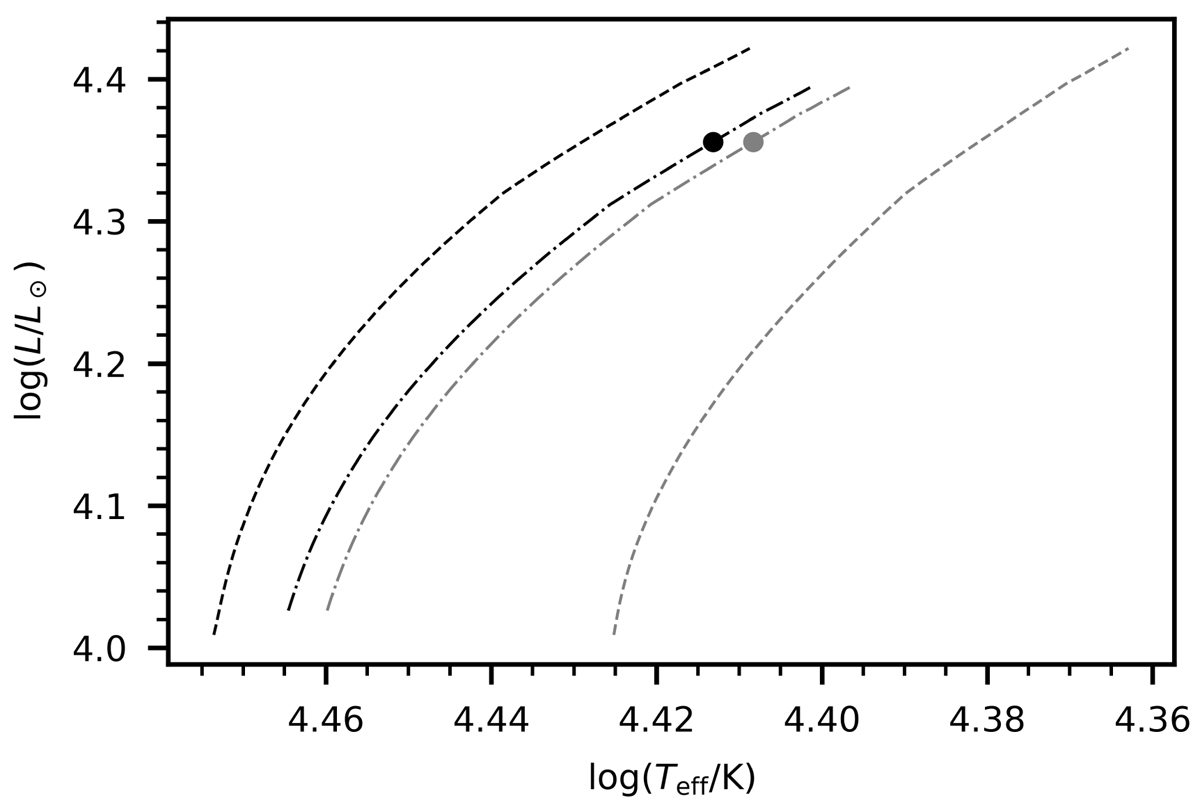
HRD showing the evolution tracks of the 2D models for a 12 M⊙ star (Z = 0.012, Xi = 0.71) for (Ωeq/Ωc)i = 0.15 (dashed-dotted), and 0.5 (dashed). The black lines represent the properties at the pole, the grey lines the properties at the equator. The tracks are terminated slightly before the TAMS when the solver can no longer converge, which occurs at Xc/Xini = 0.141 and 0.131 for the respective aforementioned rotation rates. The dots mark the model of HD 192575 that is discussed in Sect. 3.
Current usage metrics show cumulative count of Article Views (full-text article views including HTML views, PDF and ePub downloads, according to the available data) and Abstracts Views on Vision4Press platform.
Data correspond to usage on the plateform after 2015. The current usage metrics is available 48-96 hours after online publication and is updated daily on week days.
Initial download of the metrics may take a while.