Open Access
Fig. 8.
Download original image
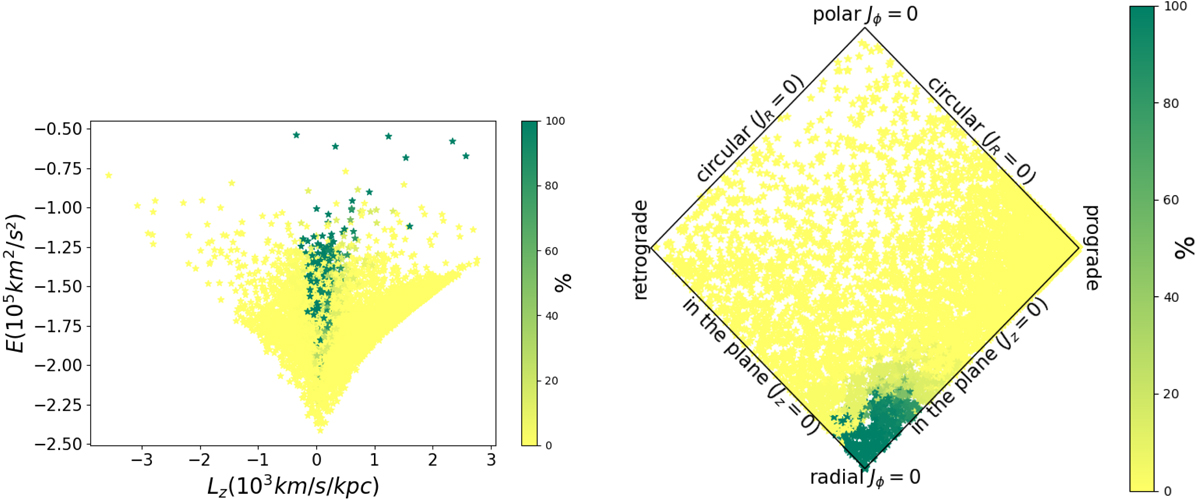
Diagrams showing how frequently each star of our sample was selected in the group we associate with the GE merger. Left: Lindblad diagram (Lz by En). Right: action map. Labels indicate the type of orbit that can be found in each region of the map.
Current usage metrics show cumulative count of Article Views (full-text article views including HTML views, PDF and ePub downloads, according to the available data) and Abstracts Views on Vision4Press platform.
Data correspond to usage on the plateform after 2015. The current usage metrics is available 48-96 hours after online publication and is updated daily on week days.
Initial download of the metrics may take a while.