Open Access
Fig. 3.
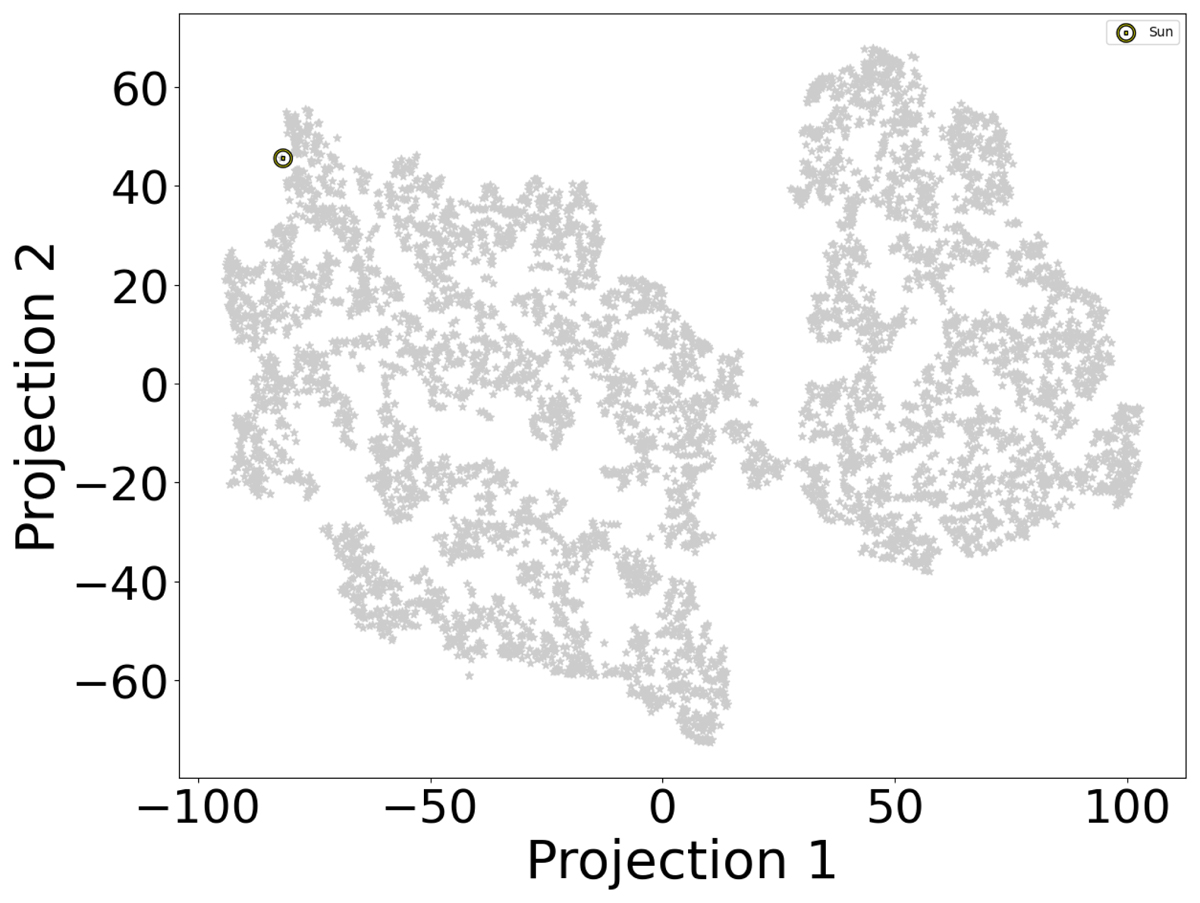
Download original image
Reduced 2D t-SNE map for our sample of metal-poor stars. The projected dimensions themselves are not connected to the physical quantities used in the analysis. This is one example from the 50 realisations of the 2D maps that were created in our analysis.
Current usage metrics show cumulative count of Article Views (full-text article views including HTML views, PDF and ePub downloads, according to the available data) and Abstracts Views on Vision4Press platform.
Data correspond to usage on the plateform after 2015. The current usage metrics is available 48-96 hours after online publication and is updated daily on week days.
Initial download of the metrics may take a while.