Open Access
Fig. 2.
Download original image
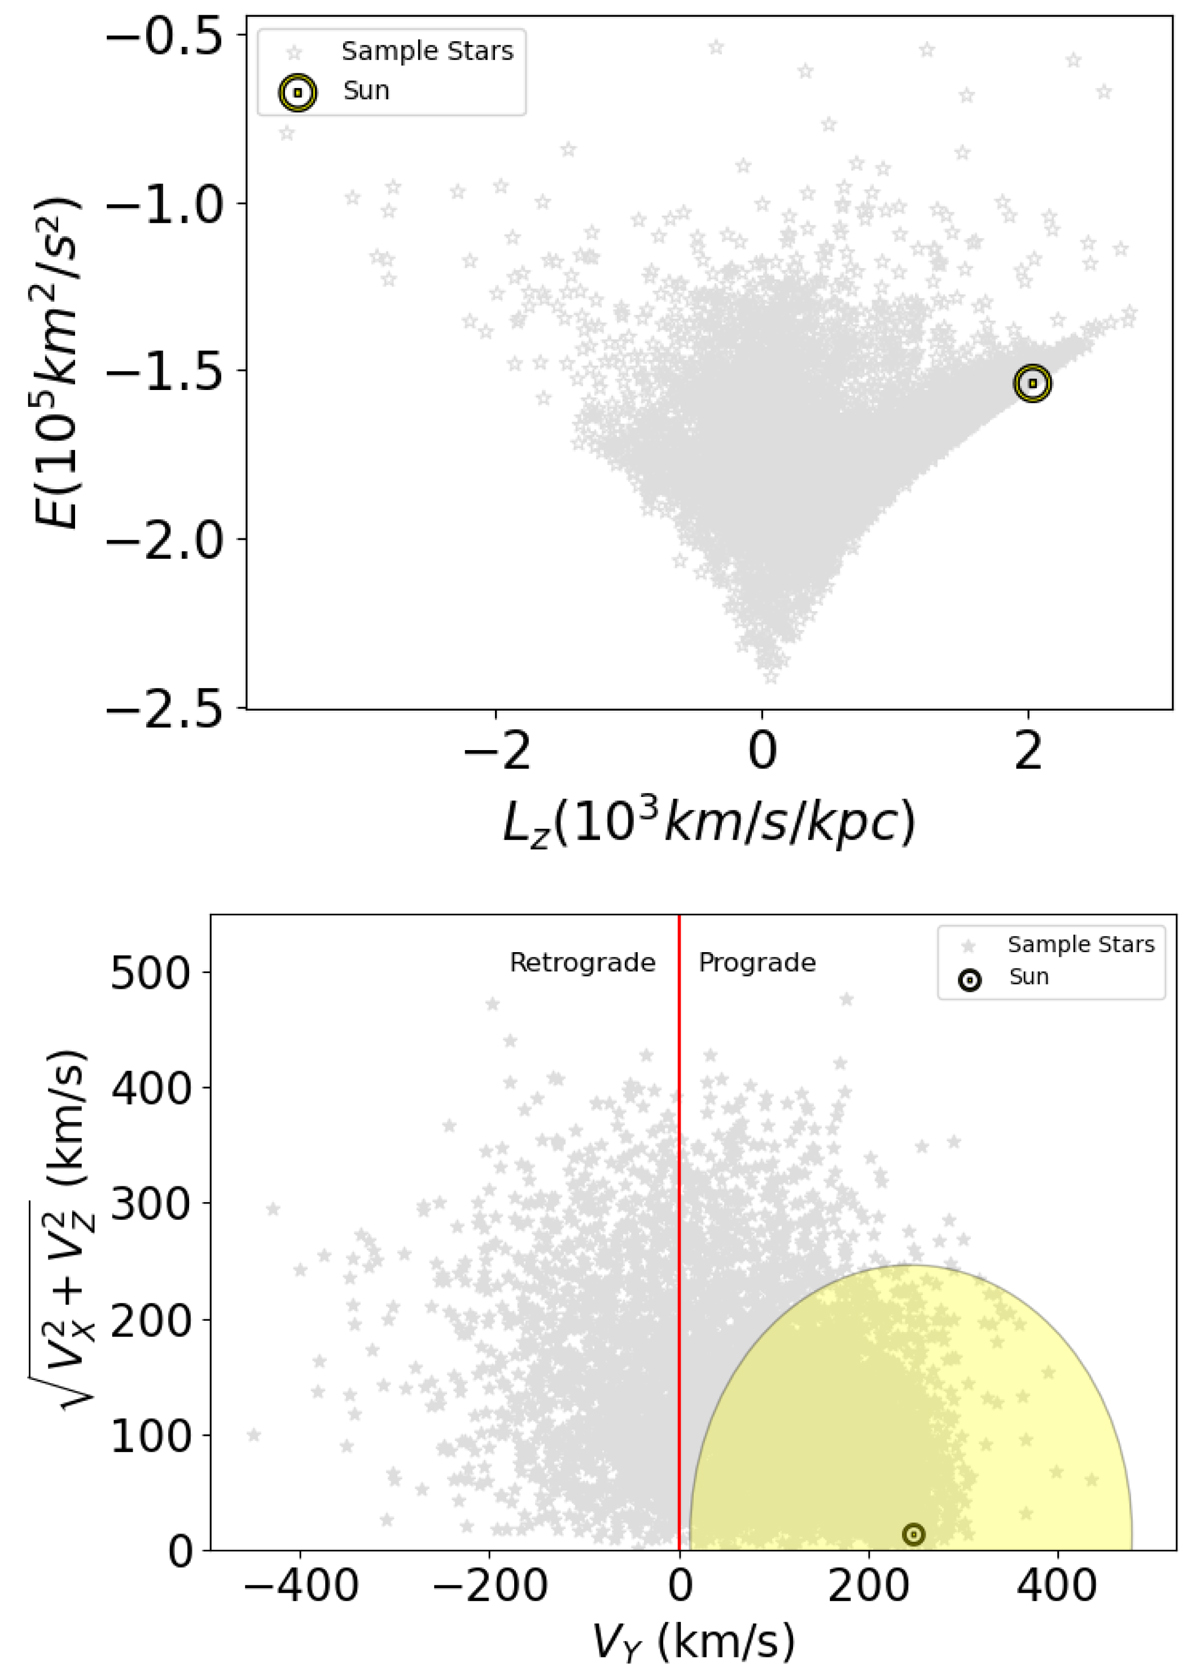
Dynamic diagrams for our sample. Top: Lindblad diagram with our sample stars in grey. The Sun is included to serve as a reference. Bottom: Toomre diagram with our sample stars in grey. The yellow circle delineates the region of stars with total velocity below 233 km s−1 (McMillan 2017). The Sun is also shown for reference.
Current usage metrics show cumulative count of Article Views (full-text article views including HTML views, PDF and ePub downloads, according to the available data) and Abstracts Views on Vision4Press platform.
Data correspond to usage on the plateform after 2015. The current usage metrics is available 48-96 hours after online publication and is updated daily on week days.
Initial download of the metrics may take a while.