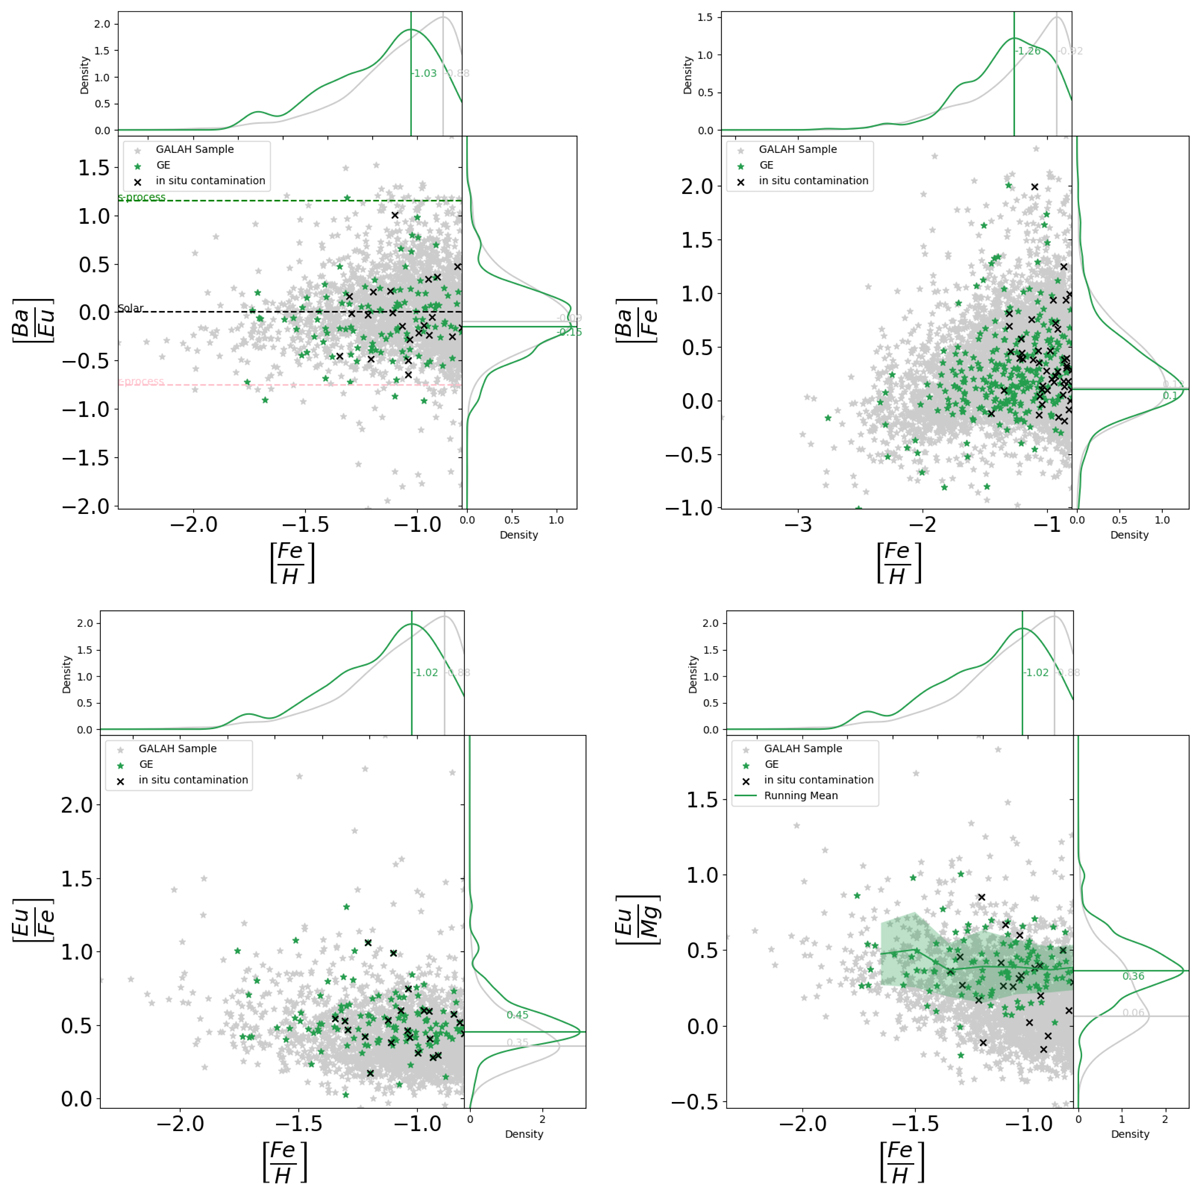
Fig. 16.
Download original image
Ba and Eu abundance diagrams for the GE-dominated group. In grey, the whole sample of metal-poor stars is shown. Black crosses are stars of the GE-dominated group that were found to be of in situ origin and high values of [Al/Fe]. The green symbols are the remaining stars of the group. Top left: [Ba/Eu] as a function of [Fe/H]. Dashed lines indicate the solar ratio, and the values for pure contributions for the s- and r-processes were calculated by Bisterzo et al. (2014). The horizontal lines on the kernel density estimate (KDE) plot mark the peak values. Top right: [Eu/Ba] as a function of [Eu/Fe]. The limits of [Eu/Fe] for defining the r-I and r-II stars proposed by Beers & Christlieb (2005) are indicated. Bottom left: [Eu/Fe] as a function of [Fe/H]. Bottom right: [Eu/Mg] as a function of [Fe/H]. The green line and the green stripe show the running mean and the scatter, respectively.
Current usage metrics show cumulative count of Article Views (full-text article views including HTML views, PDF and ePub downloads, according to the available data) and Abstracts Views on Vision4Press platform.
Data correspond to usage on the plateform after 2015. The current usage metrics is available 48-96 hours after online publication and is updated daily on week days.
Initial download of the metrics may take a while.