Open Access
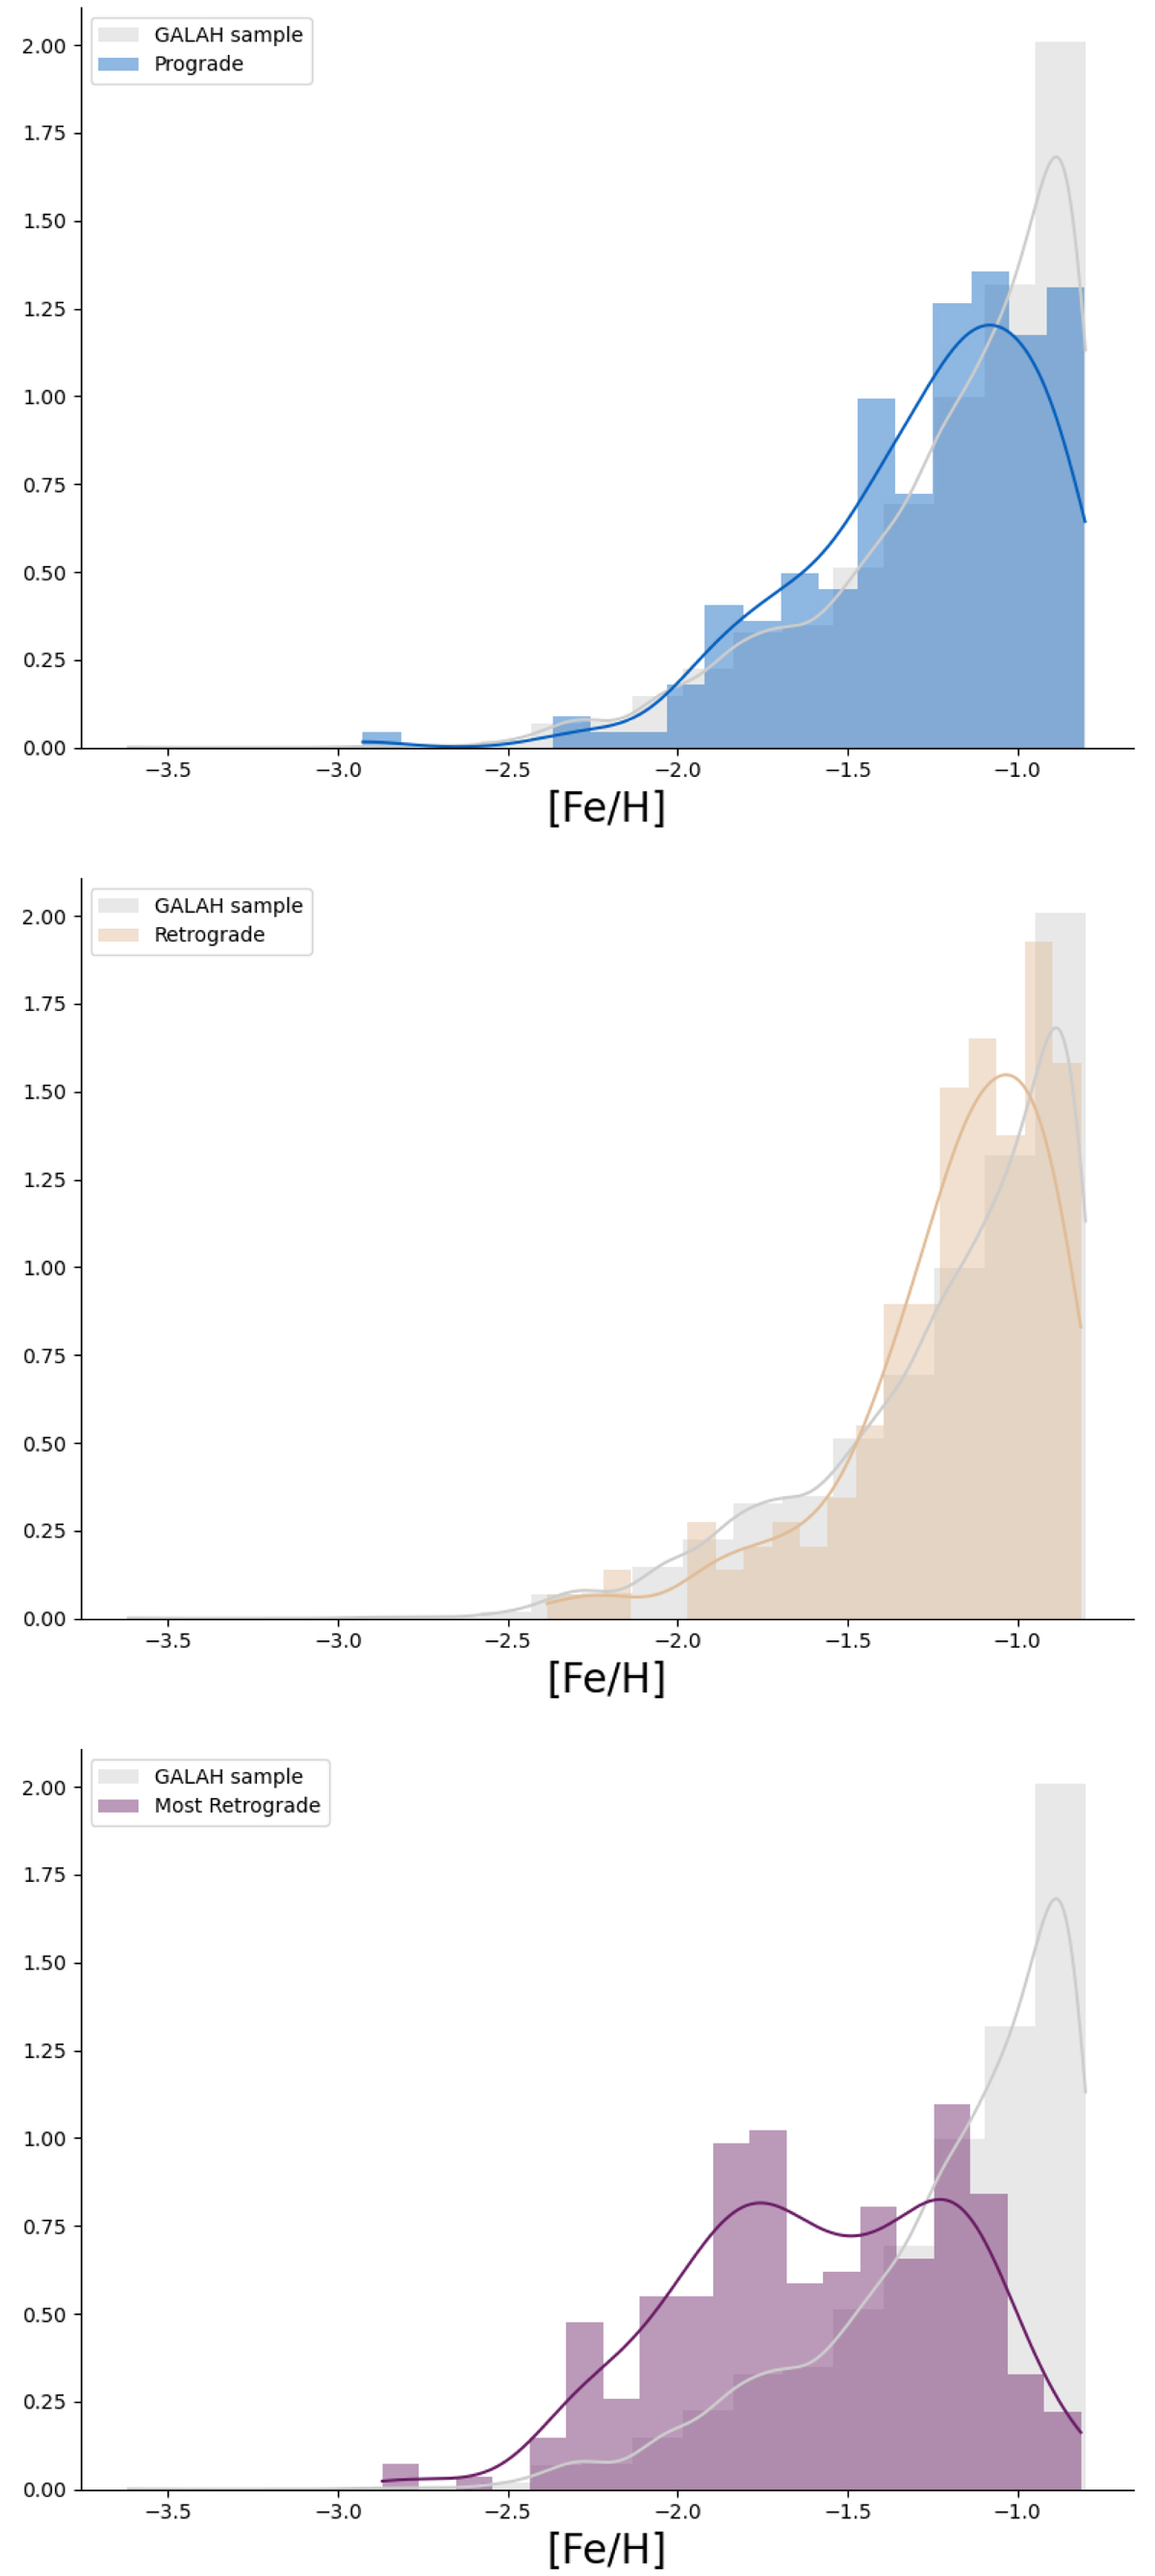
Fig. 12.
Download original image
Histograms with the metallicity distribution of the three other clusters defined in the analysis: The prograde cluster (top panel), the retrograde cluster (middle), and the most retrograde cluster (bottom).
Current usage metrics show cumulative count of Article Views (full-text article views including HTML views, PDF and ePub downloads, according to the available data) and Abstracts Views on Vision4Press platform.
Data correspond to usage on the plateform after 2015. The current usage metrics is available 48-96 hours after online publication and is updated daily on week days.
Initial download of the metrics may take a while.