Fig. 11.
Download original image
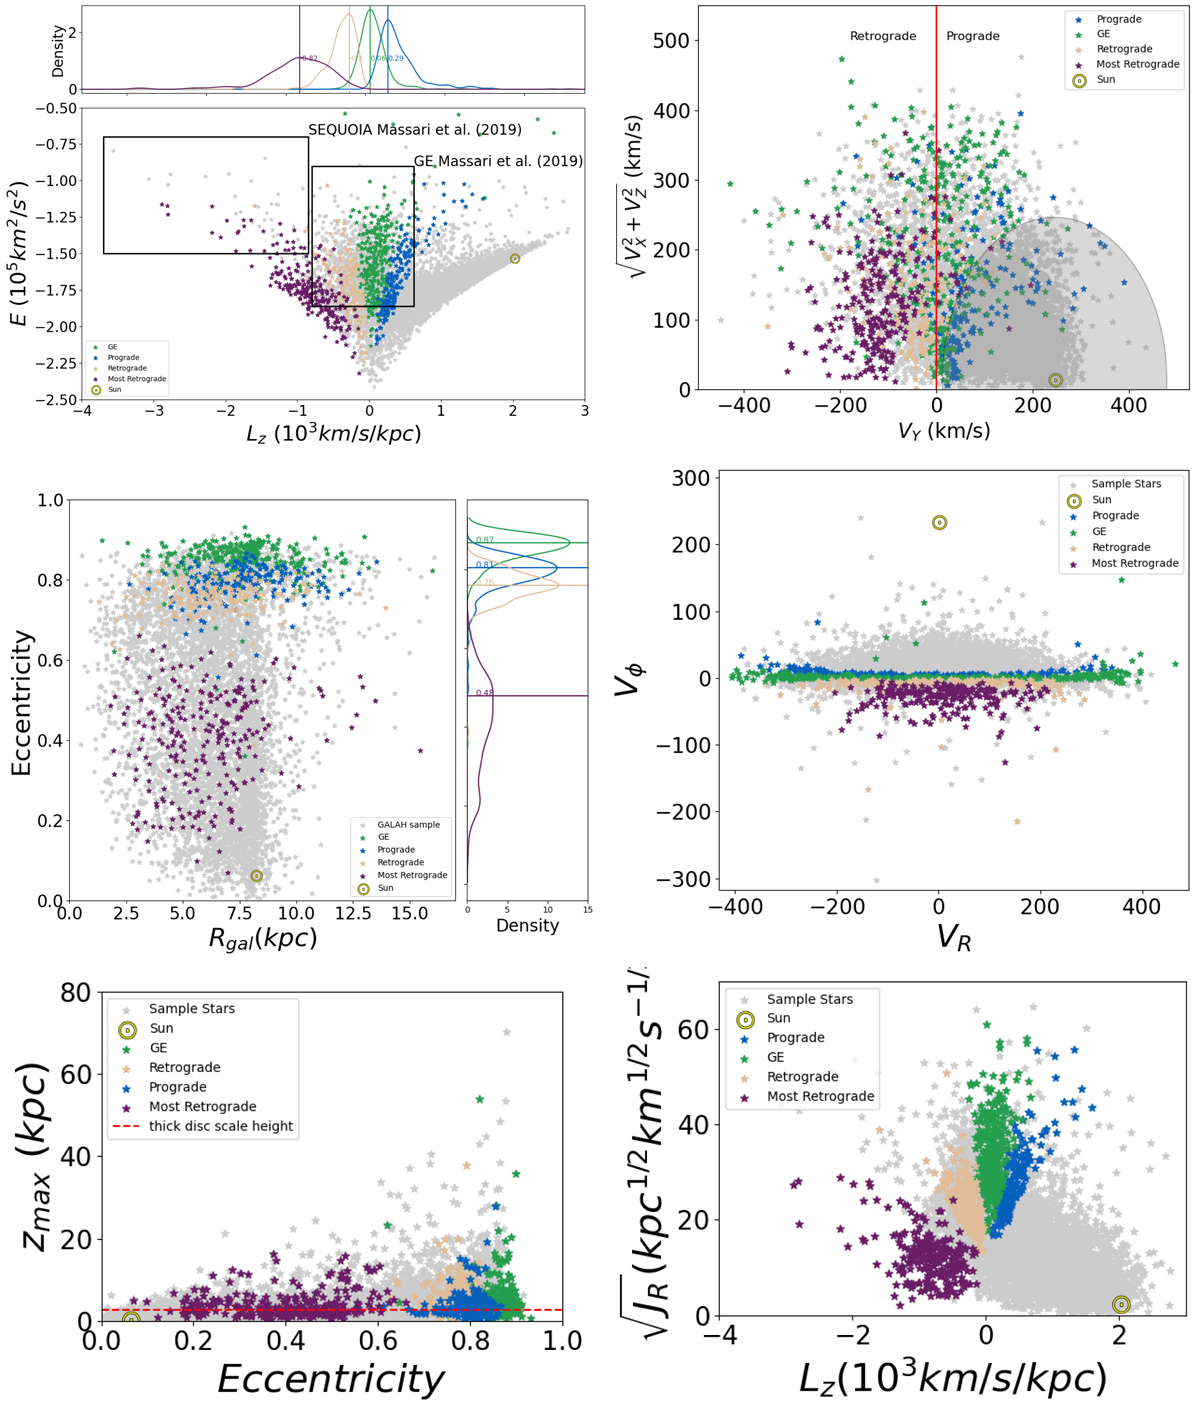
Diagrams showing the dynamic of the selected groups. In all panels, the GE is shown in light green, the prograde halo group in blue, the retrograde group in light brown, and the most retrograde group in violet. Top left: Lindblad diagram (Lz × En). Top right: Toomre Diagram. Middle left: eccentricity as a function of the galactocentric distance (Rgal). Middle right: cylindrical velocity components, Vϕ, as a function of the radial component, Vr. Bottom left: maximum distance from the Galactic (Zmax) plane as a function of eccentricity. The dashed line at Zmax = 2 kpc indicates the scale height of the thick disc (Li et al. 2018). Bottom right: radial action (![]() ) as a function of the orbital angular momentum, LZ.
) as a function of the orbital angular momentum, LZ.
Current usage metrics show cumulative count of Article Views (full-text article views including HTML views, PDF and ePub downloads, according to the available data) and Abstracts Views on Vision4Press platform.
Data correspond to usage on the plateform after 2015. The current usage metrics is available 48-96 hours after online publication and is updated daily on week days.
Initial download of the metrics may take a while.