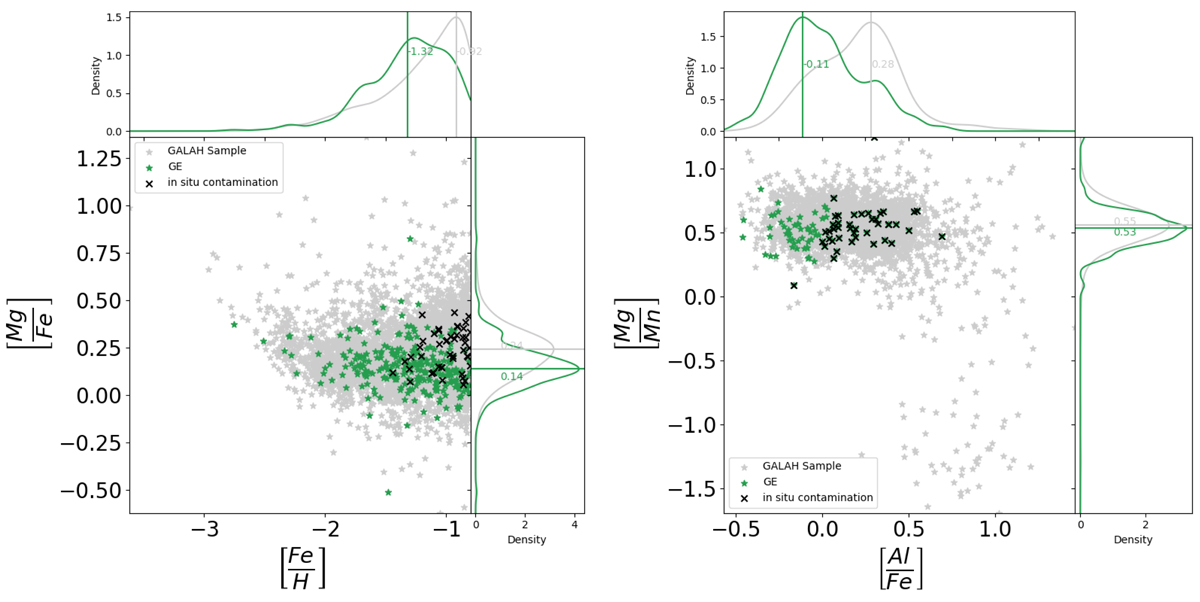
Fig. 10.
Download original image
Diagrams of [Mg/Fe] versus [Fe/H], and [Mg/Mn] versus [Al/Fe] for our GE. Stars selected with [Fe/H] ≤ −0.8 are shown in grey. The stars of the GE-dominated cluster are shown in other colours (347 stars in the left panel; 94 stars in the right panel). Black crosses are (43) stars with high [Al/Fe] ratios and thus are likely of in situ origin. Green star symbols are objects with low [Al/Fe] ratios or without Mn and/or Al abundances of good quality. The latter group is likely dominated by stars of accreted origin. Left: [Mg/Fe] by [Fe/H] diagram. Right: [Mg/Mn] by [Al/Fe] diagram.
Current usage metrics show cumulative count of Article Views (full-text article views including HTML views, PDF and ePub downloads, according to the available data) and Abstracts Views on Vision4Press platform.
Data correspond to usage on the plateform after 2015. The current usage metrics is available 48-96 hours after online publication and is updated daily on week days.
Initial download of the metrics may take a while.