Fig. 3
Download original image
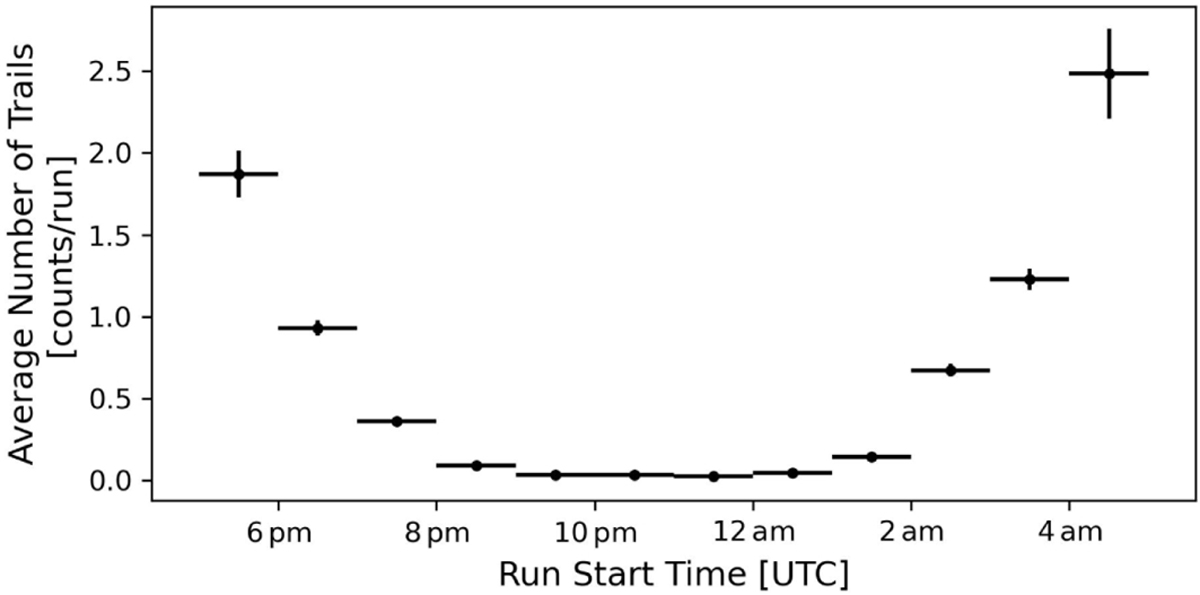
Histogram of the average number of satellite trails we detected as a function of the time at the start of the run (including runs where we detect no trails). Most satellite trails are detected close to the beginning and end of the night when visibility of low-orbit satellites is greatest (Hainaut & Williams 2020; Bassa et al. 2022). The horizontal errors indicate the size of the bins (also the case for Figs. 4–8).
Current usage metrics show cumulative count of Article Views (full-text article views including HTML views, PDF and ePub downloads, according to the available data) and Abstracts Views on Vision4Press platform.
Data correspond to usage on the plateform after 2015. The current usage metrics is available 48-96 hours after online publication and is updated daily on week days.
Initial download of the metrics may take a while.