Fig. 5.
Download original image
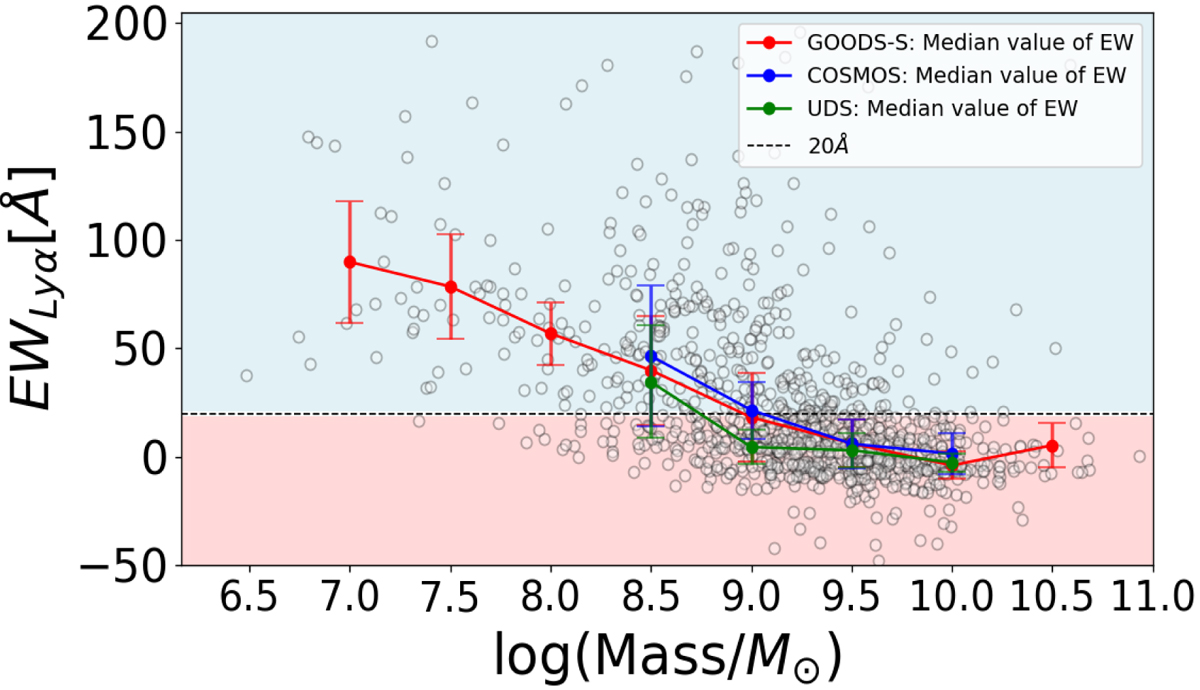
Lyα EW vs. total stellar mass estimates. The horizontal black dashed line shows the 20 Å threshold a source has to exceed to be considered a LAE. For readability, the blue and red portions of the figure mark LAE and NLAE populations respectively. Red, blue, and green trends represent respectively the EW median values in Mass bin of 0.5 dex for GOODS-S, COSMOS, and UDS fields. They are associated with an error bar, accounting for the median absolute deviation.
Current usage metrics show cumulative count of Article Views (full-text article views including HTML views, PDF and ePub downloads, according to the available data) and Abstracts Views on Vision4Press platform.
Data correspond to usage on the plateform after 2015. The current usage metrics is available 48-96 hours after online publication and is updated daily on week days.
Initial download of the metrics may take a while.