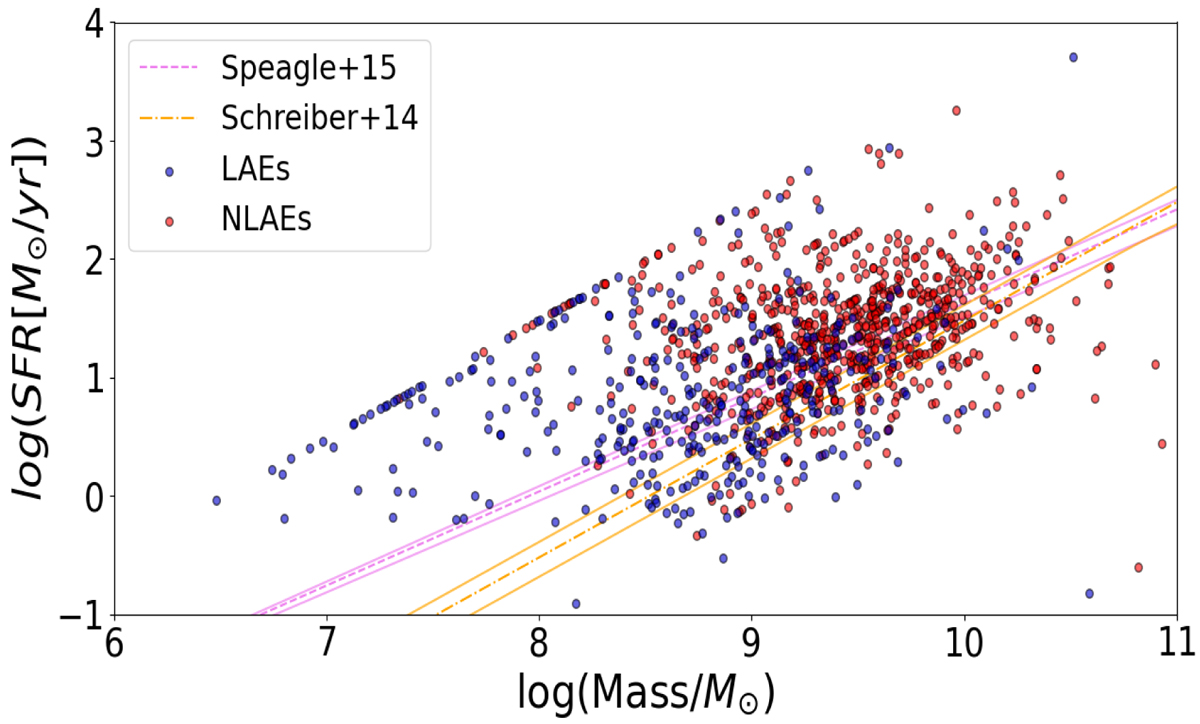
Fig. 3.
Download original image
Main sequence diagram of the 1115 galaxies in the redshift range z ∈ [2.5, 4.5]. The yellow dot-dashed line indicates the best fit relation Schreiber et al. (2015) at z = 3.5, the continuous yellow lines refer to the fits at z = 2.5 and z = 4.5. The pink dashed line indicates the fit by Speagle et al. (2014) at z = 3.5, while the continuous pink lines refer to the fits at z = 2.5 and z = 4.5.
Current usage metrics show cumulative count of Article Views (full-text article views including HTML views, PDF and ePub downloads, according to the available data) and Abstracts Views on Vision4Press platform.
Data correspond to usage on the plateform after 2015. The current usage metrics is available 48-96 hours after online publication and is updated daily on week days.
Initial download of the metrics may take a while.