Open Access
Fig. 2.
Download original image
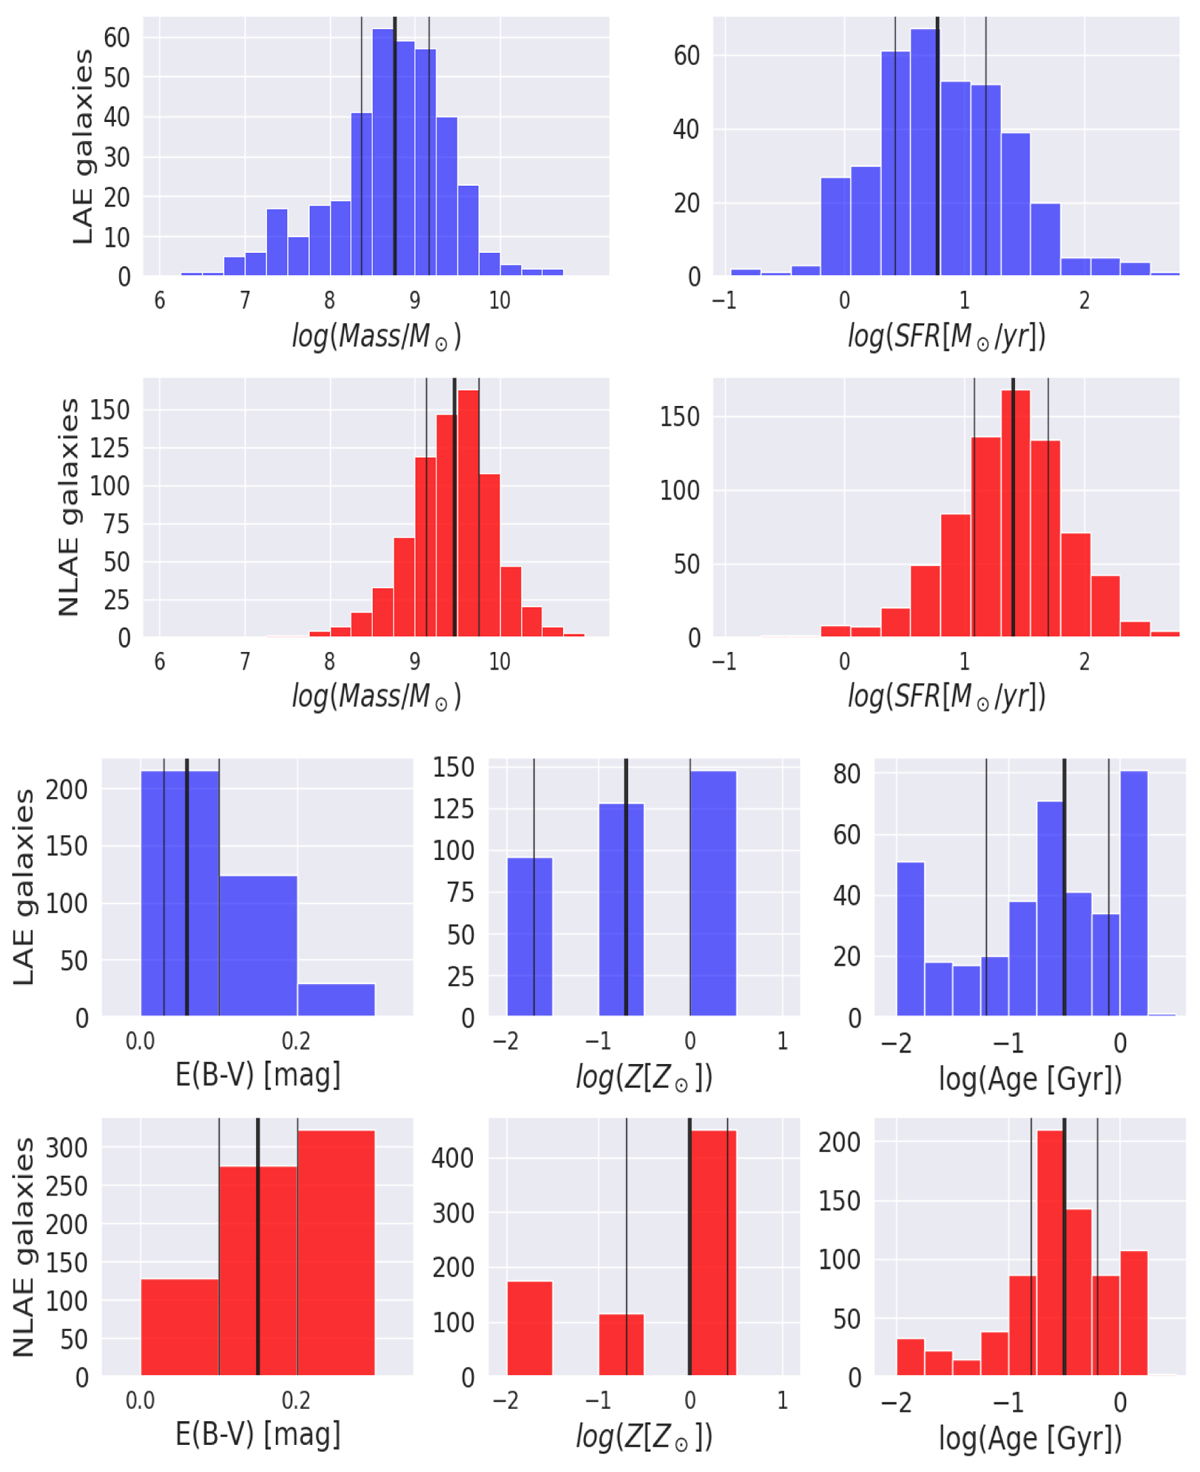
Distributions of the physical parameters of the 1115 galaxies in the redshift range z ∈ [2.5, 4.5]. We show a direct comparison between LAEs (blue) and NLAEs (red). The thick and thin black lines correspond to the median, 25 percentile, and 75 percentile values of the distributions.
Current usage metrics show cumulative count of Article Views (full-text article views including HTML views, PDF and ePub downloads, according to the available data) and Abstracts Views on Vision4Press platform.
Data correspond to usage on the plateform after 2015. The current usage metrics is available 48-96 hours after online publication and is updated daily on week days.
Initial download of the metrics may take a while.