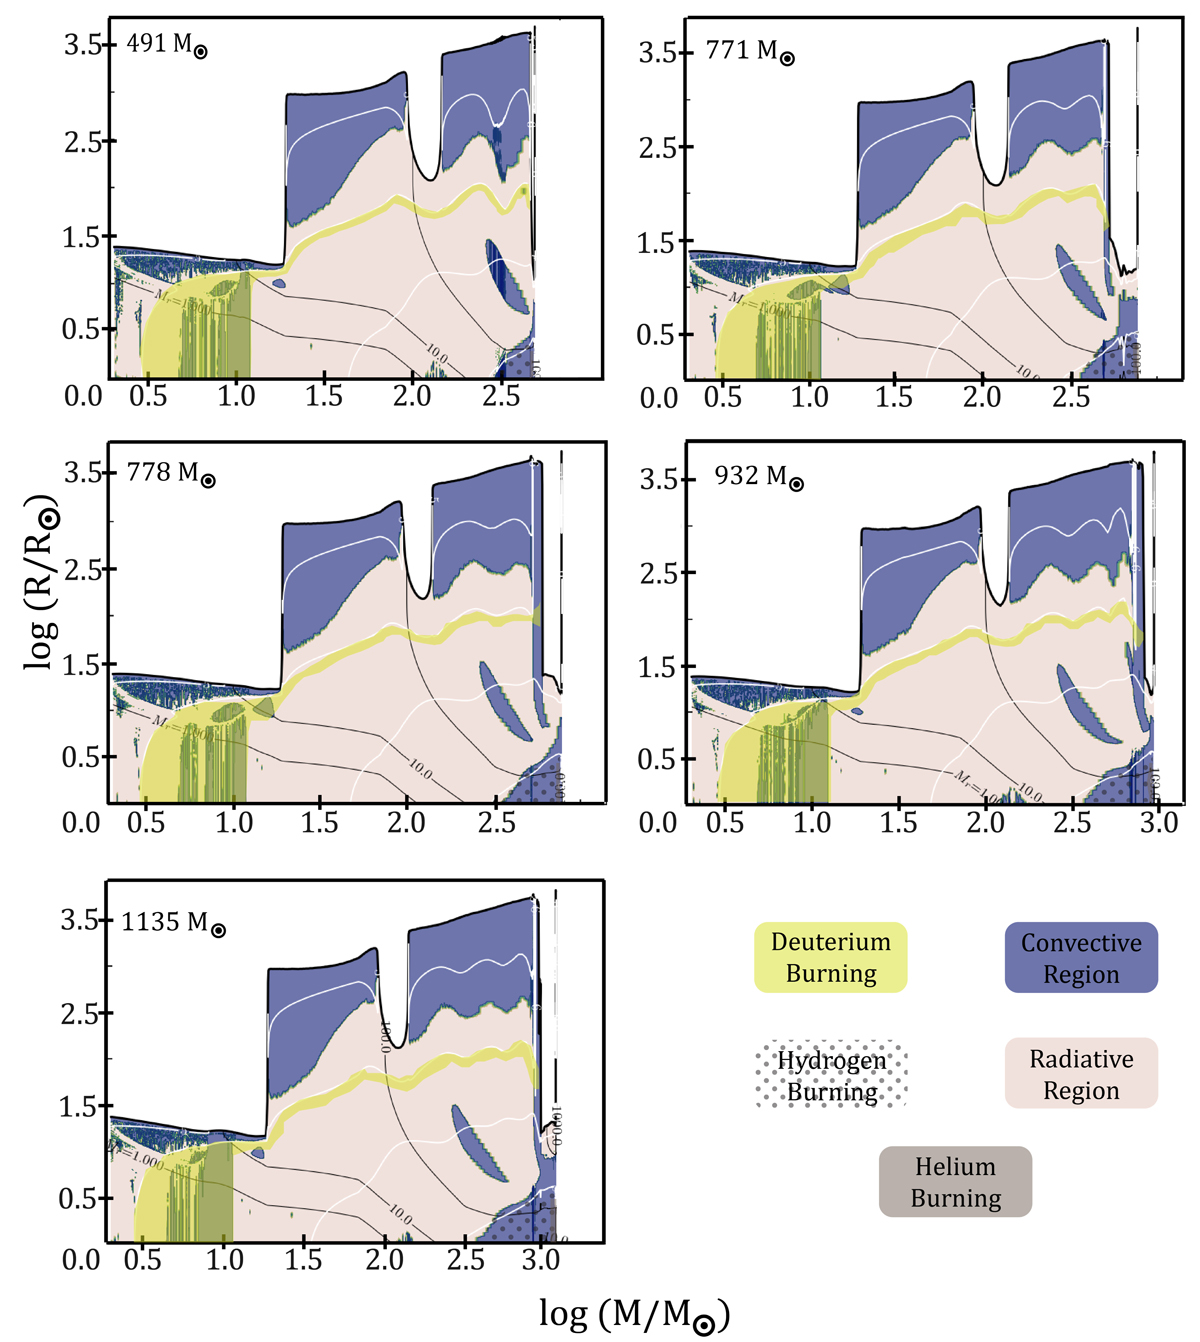
Fig. 6.
Download original image
Kippenhahn diagrams depicting the evolution of radius versus mass (both axes represented in log scale) for low-mass models. The details of the diagrams are similar to Fig. 5. In this version of the diagrams, the change in radius during the pre-MS evolution of all models is clearly visible. All models undergo the luminosity wave at log (M/M⊙) = 1.3 and experience a strong increase in radius. The next noteworthy evolutionary trend is at log (M/M⊙) = 1.95 when the models undergo a drop in accretion rate below Ṁcrit,preMS which results in a decrease in radius. Eventually the accretion rate increases above the Ṁcrit,preMS.
Current usage metrics show cumulative count of Article Views (full-text article views including HTML views, PDF and ePub downloads, according to the available data) and Abstracts Views on Vision4Press platform.
Data correspond to usage on the plateform after 2015. The current usage metrics is available 48-96 hours after online publication and is updated daily on week days.
Initial download of the metrics may take a while.