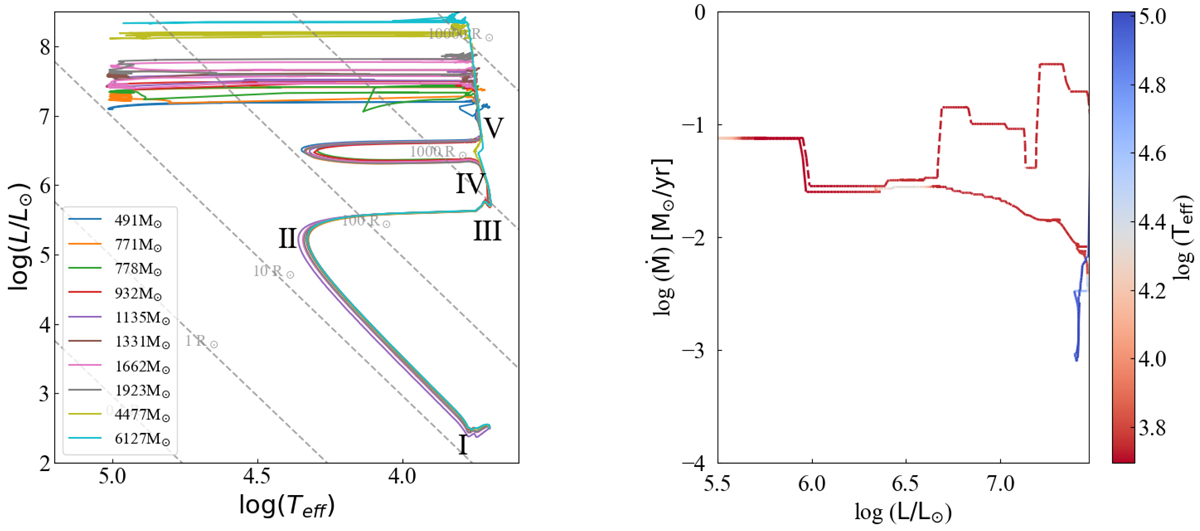
Fig. 3.
Download original image
Evolution of accreting PopIII models. Left panel: HR diagram depicting the evolution for ten models with varying accretion rates. The models are labelled according to their final mass. Grey dashed lines represent isoradii. Models 491, 771, 778, 932, 1135, 1331, 1662, and 1923 have near-identical pre-MS accretion histories, unlike models 4477 and 6127. All models except 4477 complete accretion before hydrogen burning starts at log (Teff) = 5.10. Computation stops after core helium burning, with all models in the red at log (Teff)≈3.76. Right panel: evolution of the accretion rate versus the luminosity for the 1662 (solid line) and 4477 (dashed line) models, colour-coded by the effective temperature. Quantities are displayed on a log scale, focusing on a zoomed-in region of the pre-MS. Both models share an identical accretion history until reaching a luminosity of log (L/L⊙) = 5.95. The 1662 model experiences a drop in the accretion rate below 2.5 × 10⁻² M⊙ yr−1, while the 4477 model remains above this value.
Current usage metrics show cumulative count of Article Views (full-text article views including HTML views, PDF and ePub downloads, according to the available data) and Abstracts Views on Vision4Press platform.
Data correspond to usage on the plateform after 2015. The current usage metrics is available 48-96 hours after online publication and is updated daily on week days.
Initial download of the metrics may take a while.