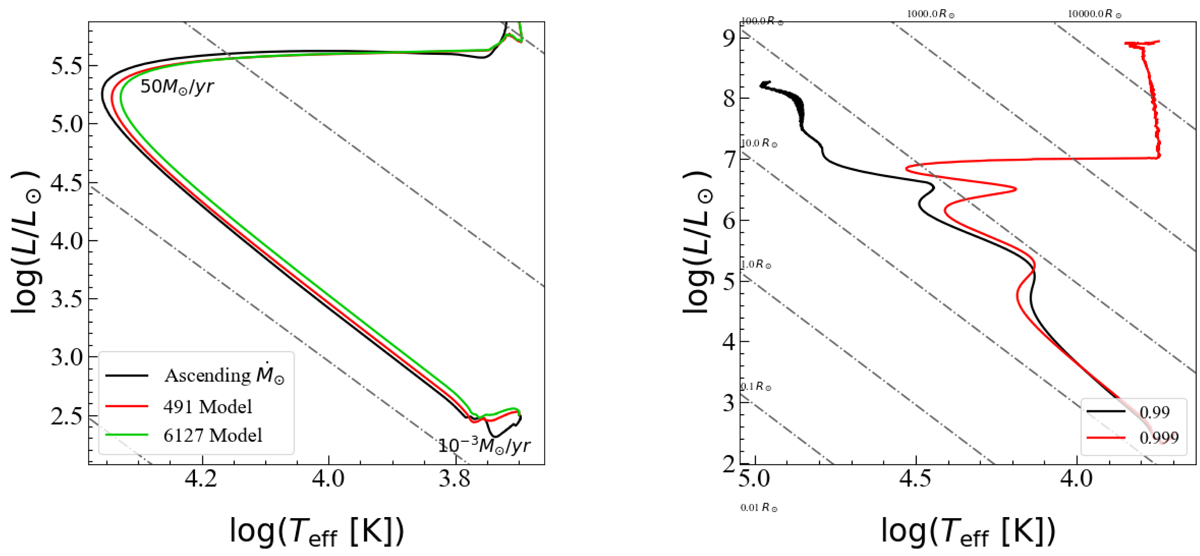
Fig. E.2.
Download original image
Numerical tests exploring the pre-MS evolution of accreting models. left panel: Zoomed-in region of the pre-MS of three models: Ascending M⊙ (black line), model 491 (red line), and model 6127 (green line) shown in the HR diagram. For the ascending model, the accretion rate begins as 10−3 M⊙/yr, changes every 10 years by a factor of five until it reaches 50M⊙/yr at the age of 110 years. The pre-MS evolution is very similar to that of models 491 and 6127, showing that at least in the early contraction phase, changing the accretion rate has minimal impact on the evolutionary track. Right panel: Impact of FITM on 10−2 M⊙ yr−1 models. The black line represents a FITM of 0.990 and the red line depicts a FITM of 0.999.
Current usage metrics show cumulative count of Article Views (full-text article views including HTML views, PDF and ePub downloads, according to the available data) and Abstracts Views on Vision4Press platform.
Data correspond to usage on the plateform after 2015. The current usage metrics is available 48-96 hours after online publication and is updated daily on week days.
Initial download of the metrics may take a while.