Fig. 1.
Download original image
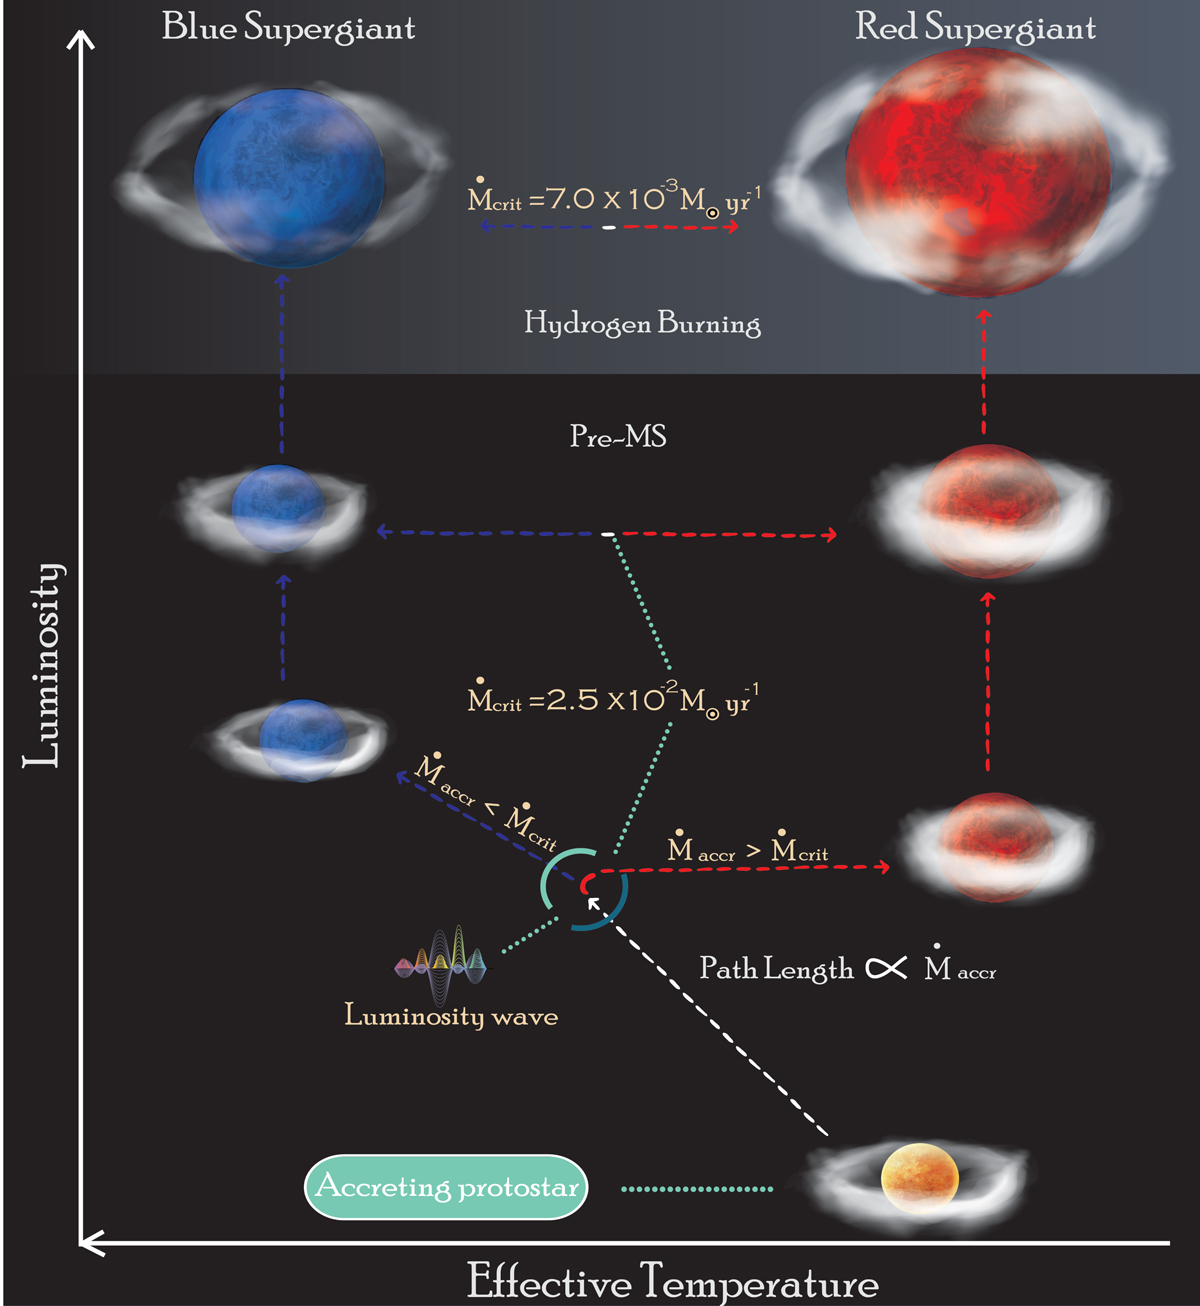
Illustration depicting the impact of the critical accretion rate (Ṁcrit) on the evolution of a star. The yellow object represents the protostellar seed and the wave pattern depicts the luminosity wave. The contraction towards blue is depicted with blue lines, whereas the expansion towards red is shown in red lines. The white and cloudy rings represent the accretion; this is denser in cases where the accretion rate is higher than Ṁcrit and fainter when the accretion rate drops below Ṁcrit. The black background depicts the pre-MS evolution and the grey background at the top marks the core hydrogen burning phase.
Current usage metrics show cumulative count of Article Views (full-text article views including HTML views, PDF and ePub downloads, according to the available data) and Abstracts Views on Vision4Press platform.
Data correspond to usage on the plateform after 2015. The current usage metrics is available 48-96 hours after online publication and is updated daily on week days.
Initial download of the metrics may take a while.