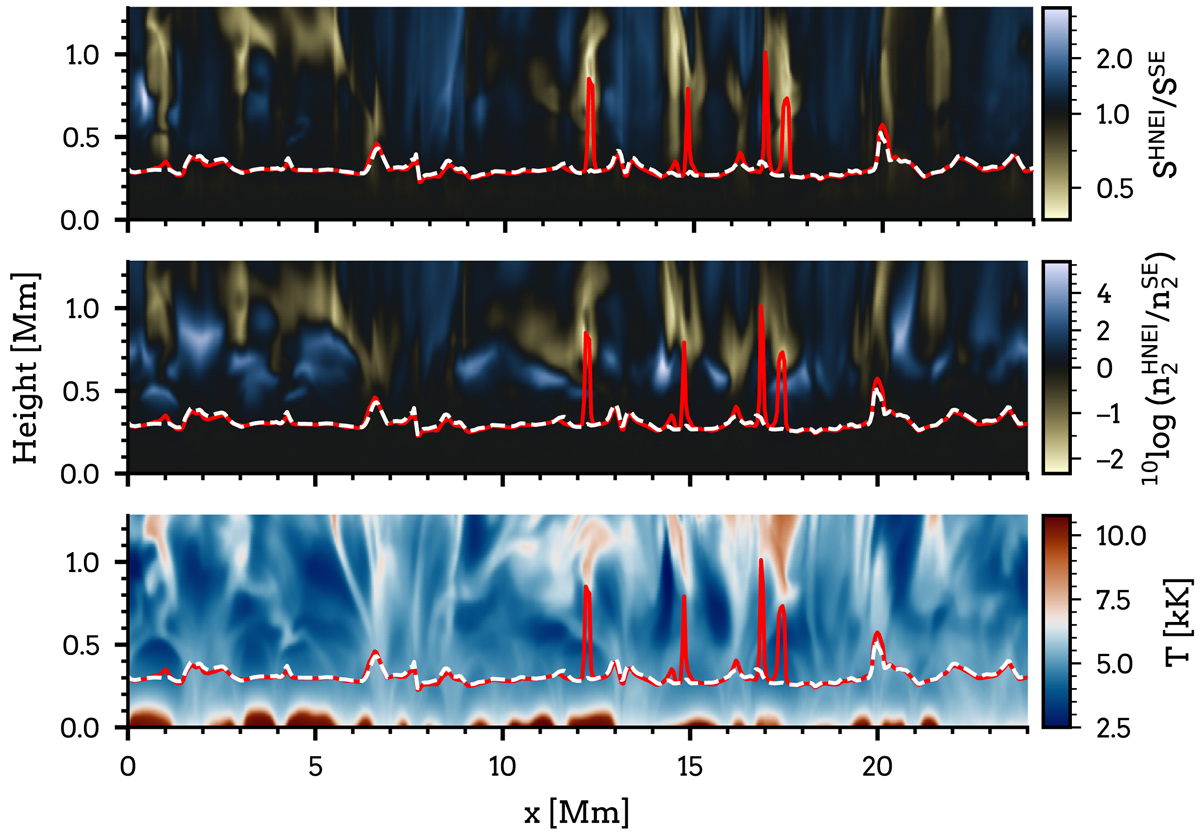
Fig. 8.
Download original image
Departures from statistical equilibrium from a vertical slice through the Bifrost simulation. Top panel: departure of the total source function from SE. Middle panel: departure of the hydrogen n = 2 populations from SE. Bottom panel: temperature structure of the Bifrost simulation. The vertical slice is taken at the position marked with white dashed lines in Fig. 6. Red solid: Hετ = 1 height for SE. White dashed: Hετ = 1 height for HNEI.
Current usage metrics show cumulative count of Article Views (full-text article views including HTML views, PDF and ePub downloads, according to the available data) and Abstracts Views on Vision4Press platform.
Data correspond to usage on the plateform after 2015. The current usage metrics is available 48-96 hours after online publication and is updated daily on week days.
Initial download of the metrics may take a while.