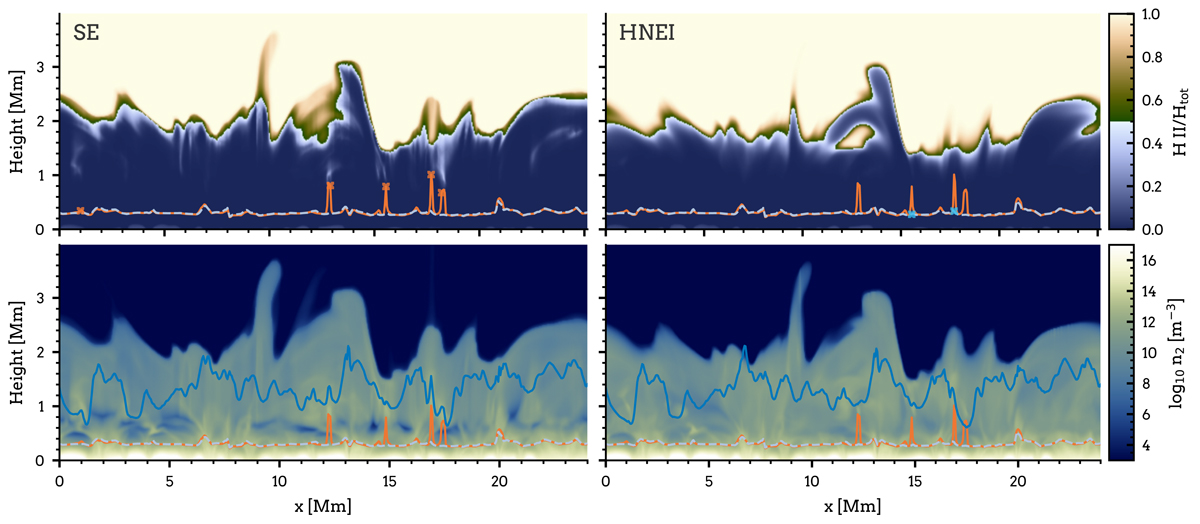
Fig. 7.
Download original image
Hydrogen ionization (top) and n = 2 populations (bottom) from a vertical slice through the simulation (indicated in Fig. 6). Left column: results for statistical equilibrium (SE). Right column: results for non-equilibrium hydrogen ionization (HNEI). The solid orange and dashed grey lines show the τ = 1 heights for both cases, and the orange crosses and light blue crosses mark regions where Hε is in emission. The dark blue line shows the relative variation of the Hε line core intensity.
Current usage metrics show cumulative count of Article Views (full-text article views including HTML views, PDF and ePub downloads, according to the available data) and Abstracts Views on Vision4Press platform.
Data correspond to usage on the plateform after 2015. The current usage metrics is available 48-96 hours after online publication and is updated daily on week days.
Initial download of the metrics may take a while.