Fig. 6.
Download original image
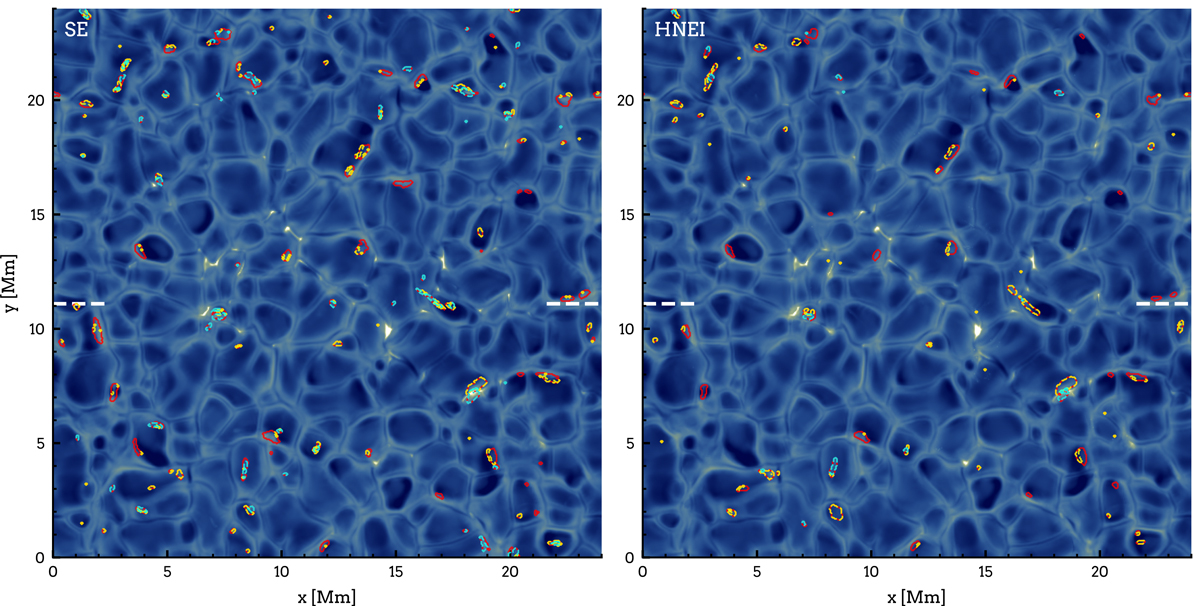
Synthetic Hε line core images at 397.1202 nm. Left panel: SE case. Right panel: HNEI case. Contours mark regions of Hε emission at different column mass regions. Yellow: column mass ≥2 × 10⁻¹ g cm−2. Red: 2 × 10⁻¹ g cm−1 > column mass > 2 × 10⁻² g cm−2. Cyan: column mass ≤ 2 × 10⁻² g cm−2. Dashed lines: position of the vertical slice shown in Fig. 7.
Current usage metrics show cumulative count of Article Views (full-text article views including HTML views, PDF and ePub downloads, according to the available data) and Abstracts Views on Vision4Press platform.
Data correspond to usage on the plateform after 2015. The current usage metrics is available 48-96 hours after online publication and is updated daily on week days.
Initial download of the metrics may take a while.