Fig. 5.
Download original image
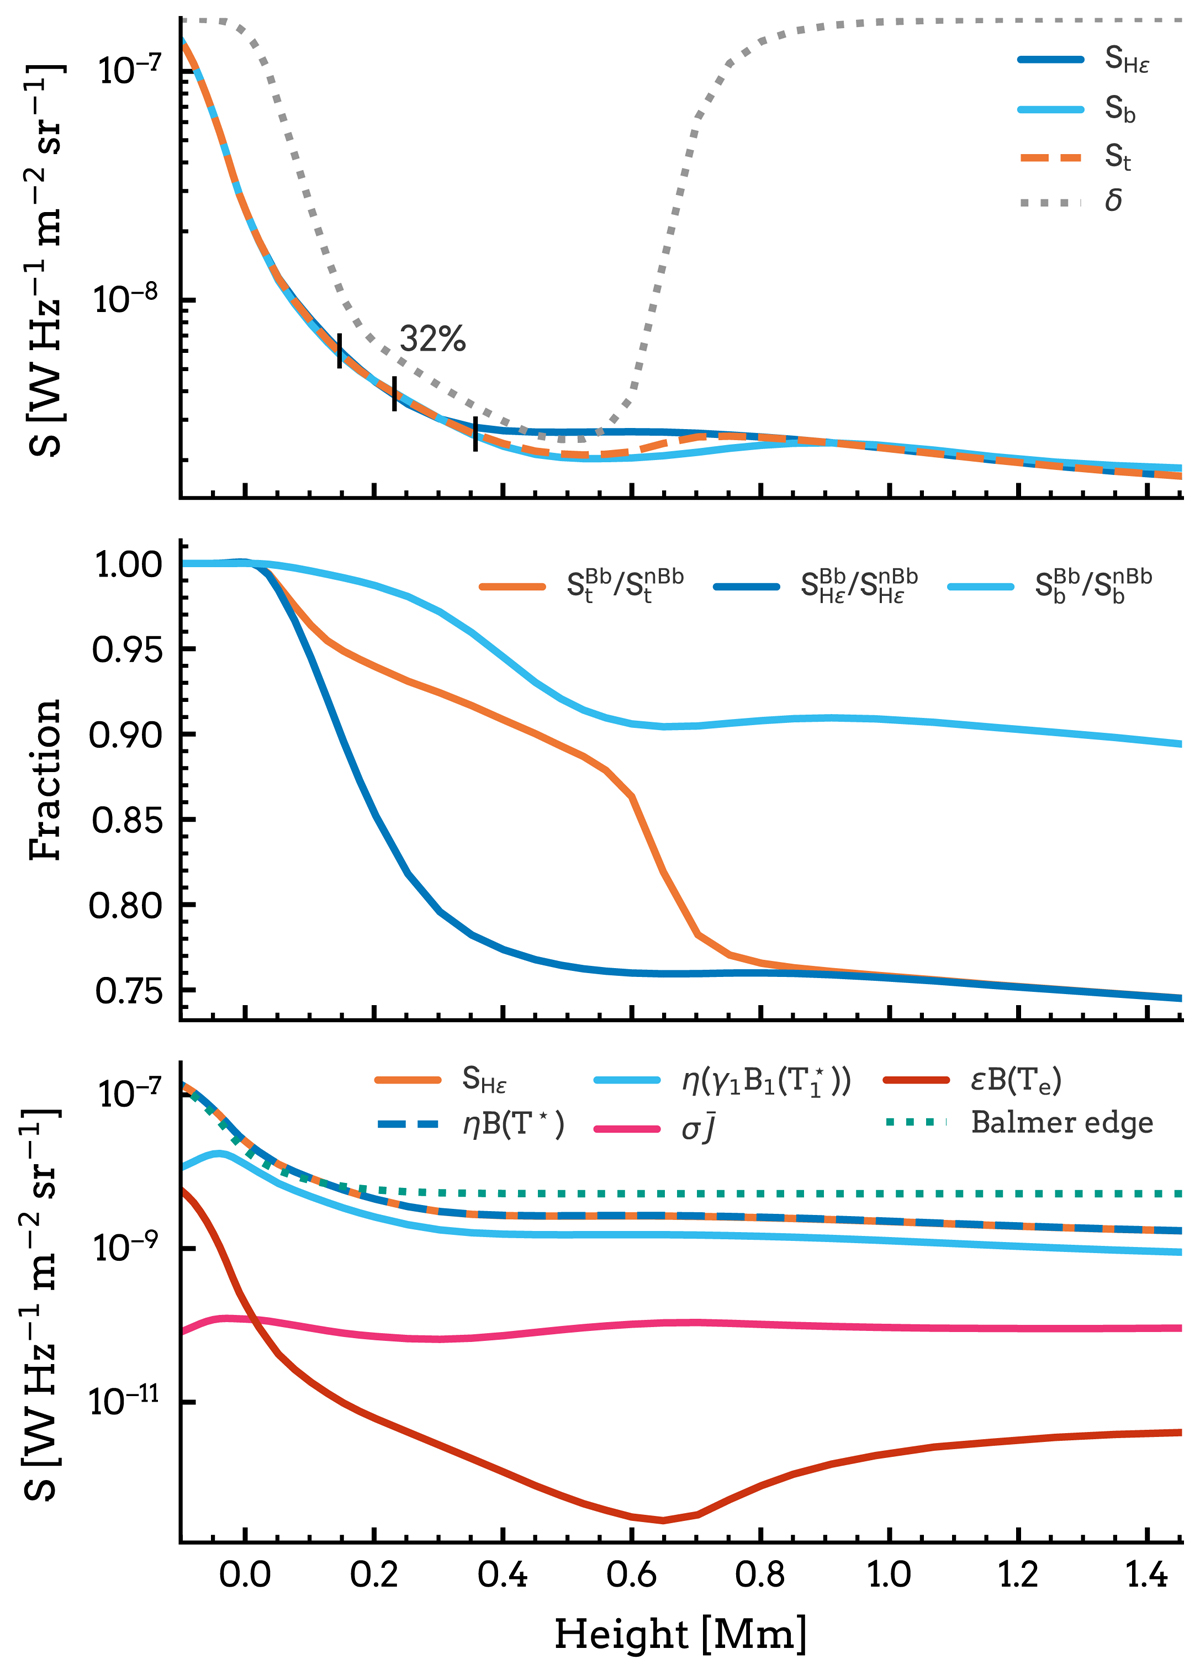
Total source function of Hε, effect of Balmer continuum line blanketing, and Hε multi-level source function for the FALC model. Upper panel: line (SHϵ), background (Sb), and total source function (St), for the FALC model including Balmer continuum line blanketing. The dotted grey line shows the ratio δ between line extinction and total extinction (Eq. (2)). The three vertical ticks mark the total optical depth heights τλ = 3, 1, 0.3. The 32% label shows that at the τλ = 1 height 32% of the total source function consists of the Hε source function. Middle panel: fraction of the total, line, and background source function including Balmer blanketing and no Balmer blanketing. The change in the total source function with Balmer blanketing results from a change in the Hε source function, only making up 32% of the total source function. Bottom panel: Hε source function split up in the multi-level source function terms (Eq. (14); scattering ![]() , thermal ϵB(Te), and interlocking ηB(Te)). The Hε source function is dominated by interlocking and not by the Balmer edge (dotted green), with the hydrogen ground level as the dominant intermediate level (
, thermal ϵB(Te), and interlocking ηB(Te)). The Hε source function is dominated by interlocking and not by the Balmer edge (dotted green), with the hydrogen ground level as the dominant intermediate level (![]() ).
).
Current usage metrics show cumulative count of Article Views (full-text article views including HTML views, PDF and ePub downloads, according to the available data) and Abstracts Views on Vision4Press platform.
Data correspond to usage on the plateform after 2015. The current usage metrics is available 48-96 hours after online publication and is updated daily on week days.
Initial download of the metrics may take a while.