Fig. 4.
Download original image
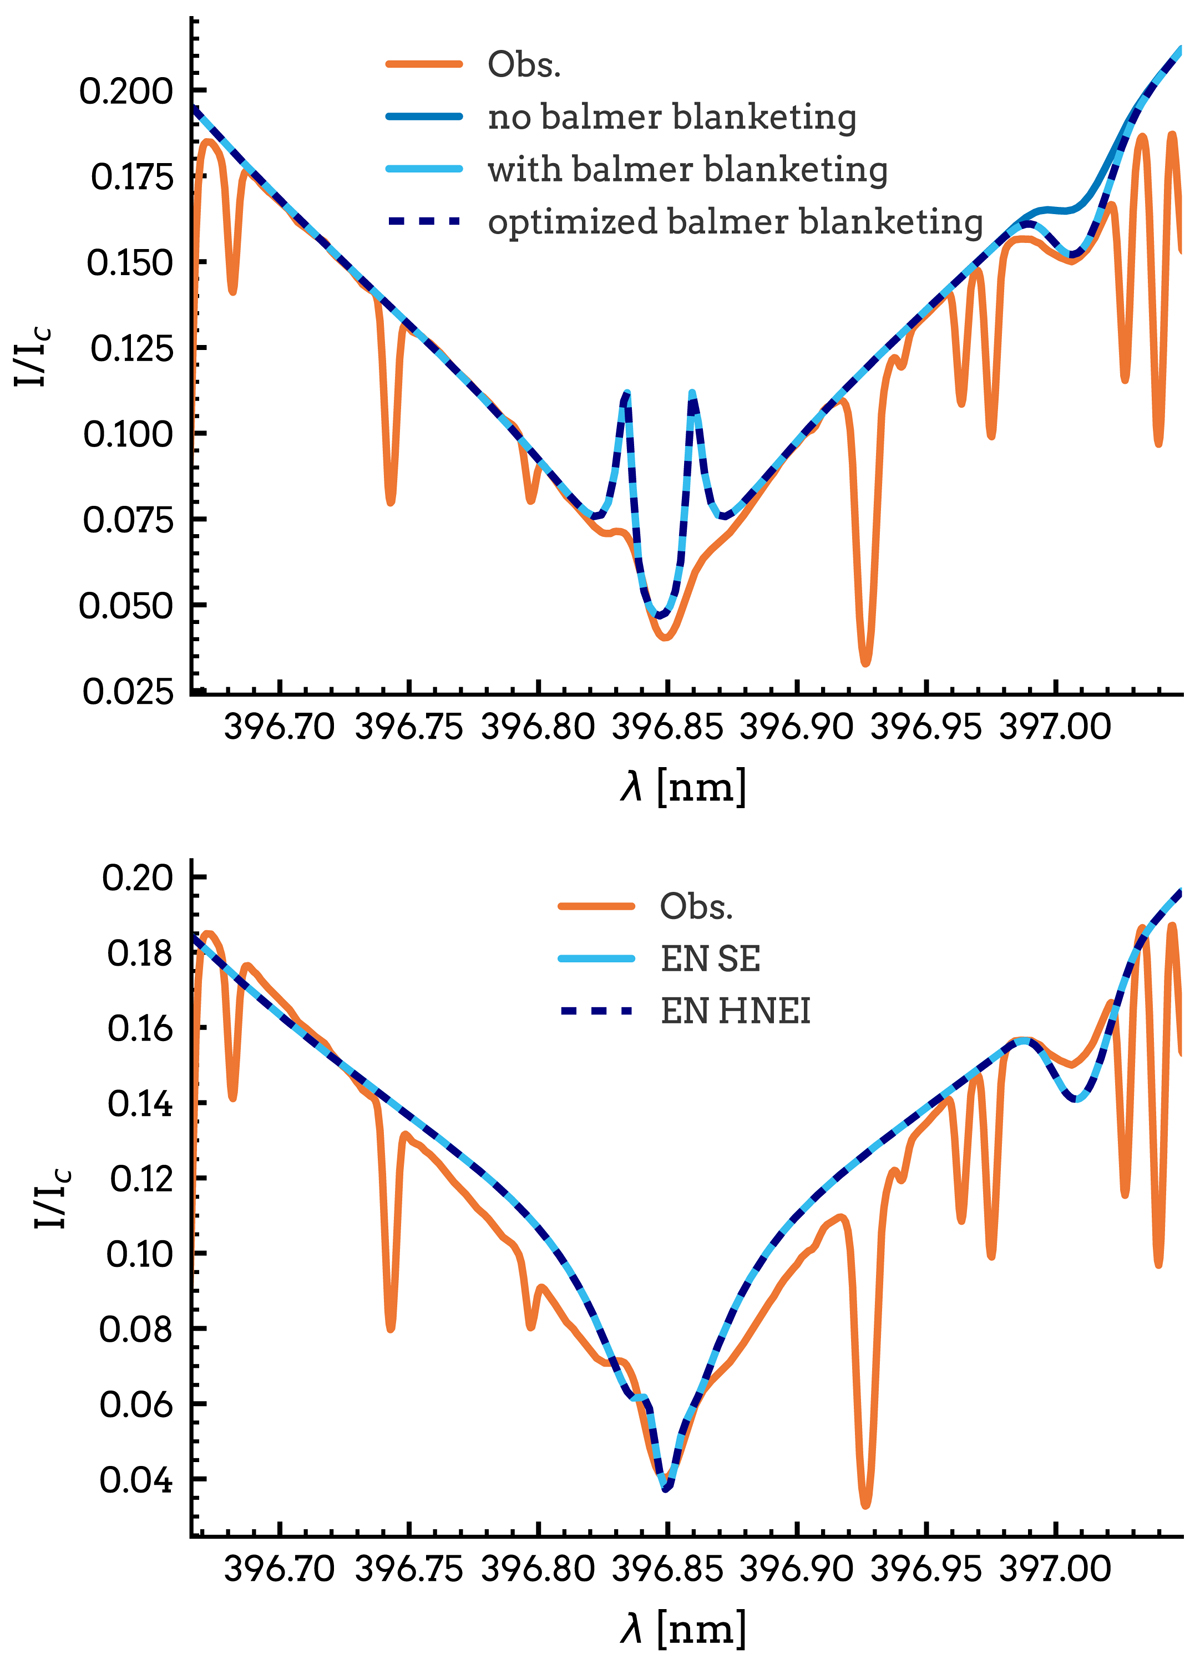
Synthetic Ca II H and Hε spectral profiles compared against a FTS atlas observation. Top panel: FTS atlas observations (orange) compared to the synthesised Ca II H plus Hε profiles from the FALC model. Blue profile for the case with no Balmer continuum blanketing, light blue for Balmer blanketing with all lines included in the Kurucz line list, and dark blue for the optimized Kurucz line list including only lines affecting the Balmer continuum radiation significantly. Bottom panel: averaged Bifrost Ca II H plus Hε profiles for the SE (light blue) and HNEI (dark blue) case against FTS atlas observations (orange).
Current usage metrics show cumulative count of Article Views (full-text article views including HTML views, PDF and ePub downloads, according to the available data) and Abstracts Views on Vision4Press platform.
Data correspond to usage on the plateform after 2015. The current usage metrics is available 48-96 hours after online publication and is updated daily on week days.
Initial download of the metrics may take a while.