Fig. 3.
Download original image
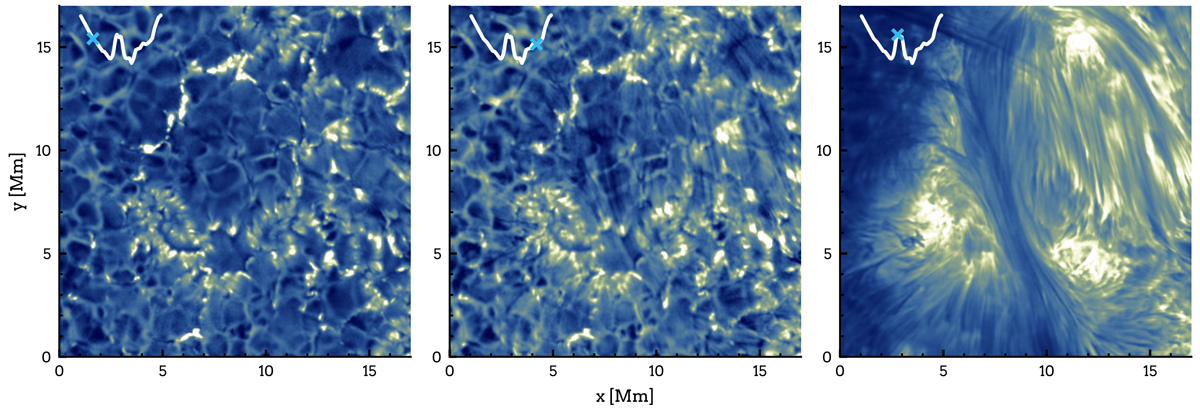
Hε and Ca II H pore observation covering a region with stronger magnetic fields (taken at 09:17:52 UT). The wavelength positions are indicated in the top left corners on an average spectral profile with light blue crosses. Left panel: Ca II H blue (−0.15 nm) wing image, showing no chromospheric structures. Middle panel: Hε line core image, showing both reversed granulation and chromospheric structures. Right panel: Ca II H line core image, dominated by chromospheric structures.
Current usage metrics show cumulative count of Article Views (full-text article views including HTML views, PDF and ePub downloads, according to the available data) and Abstracts Views on Vision4Press platform.
Data correspond to usage on the plateform after 2015. The current usage metrics is available 48-96 hours after online publication and is updated daily on week days.
Initial download of the metrics may take a while.