Fig. 2.
Download original image
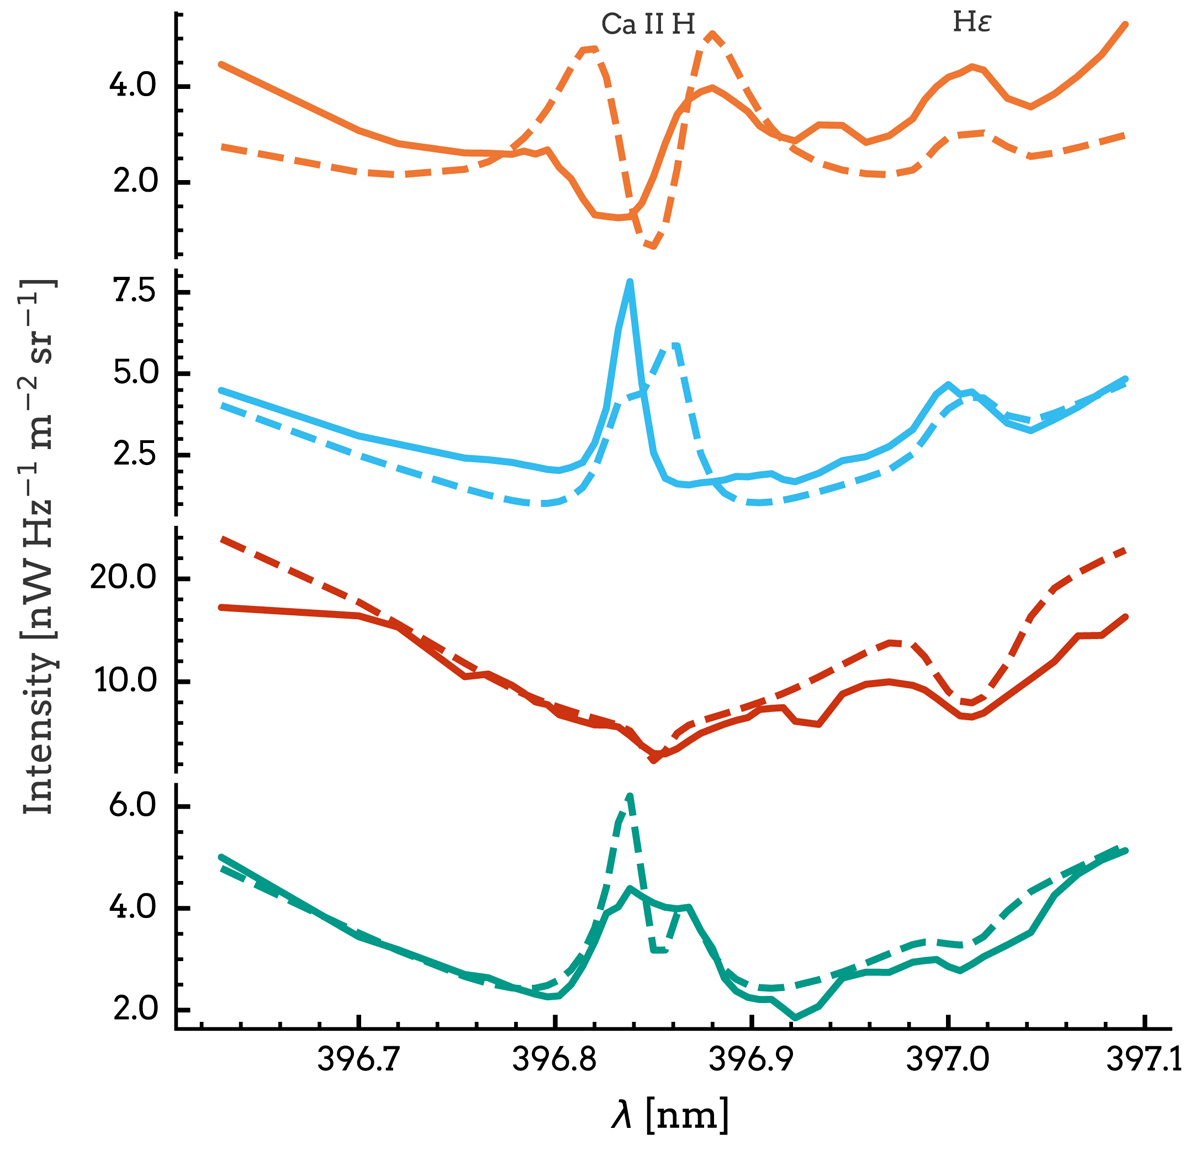
Ca II H plus Hε spectral profiles for different solar structures indicated with crosses in Fig. 1. Solid lines: observations taken with the CHROMIS instrument. Dashed lines: degraded synthetic spectra. The Hε emission profiles are shown in orange and light blue. Orange synthetic profile (1.5D HNEI) is taken from Fig. 6 at x ≈ 13.6 Mm and y ≈ 17.7 Mm (red contours). Light blue synthetic profile (1.5D HNEI) shows the same as the one in the bottom right panel of Fig. 12. The red spectral profile is taken from a magnetic bright point. The synthetic profile (3D SE) is shown in the bottom left panel of Fig. 10. The turquoise spectral profile is taken from a dark fibrilar structure. The synthetic profile (1.5D HNEI) is shown in the bottom right panel of Fig. 10.
Current usage metrics show cumulative count of Article Views (full-text article views including HTML views, PDF and ePub downloads, according to the available data) and Abstracts Views on Vision4Press platform.
Data correspond to usage on the plateform after 2015. The current usage metrics is available 48-96 hours after online publication and is updated daily on week days.
Initial download of the metrics may take a while.