Fig. 12.
Download original image
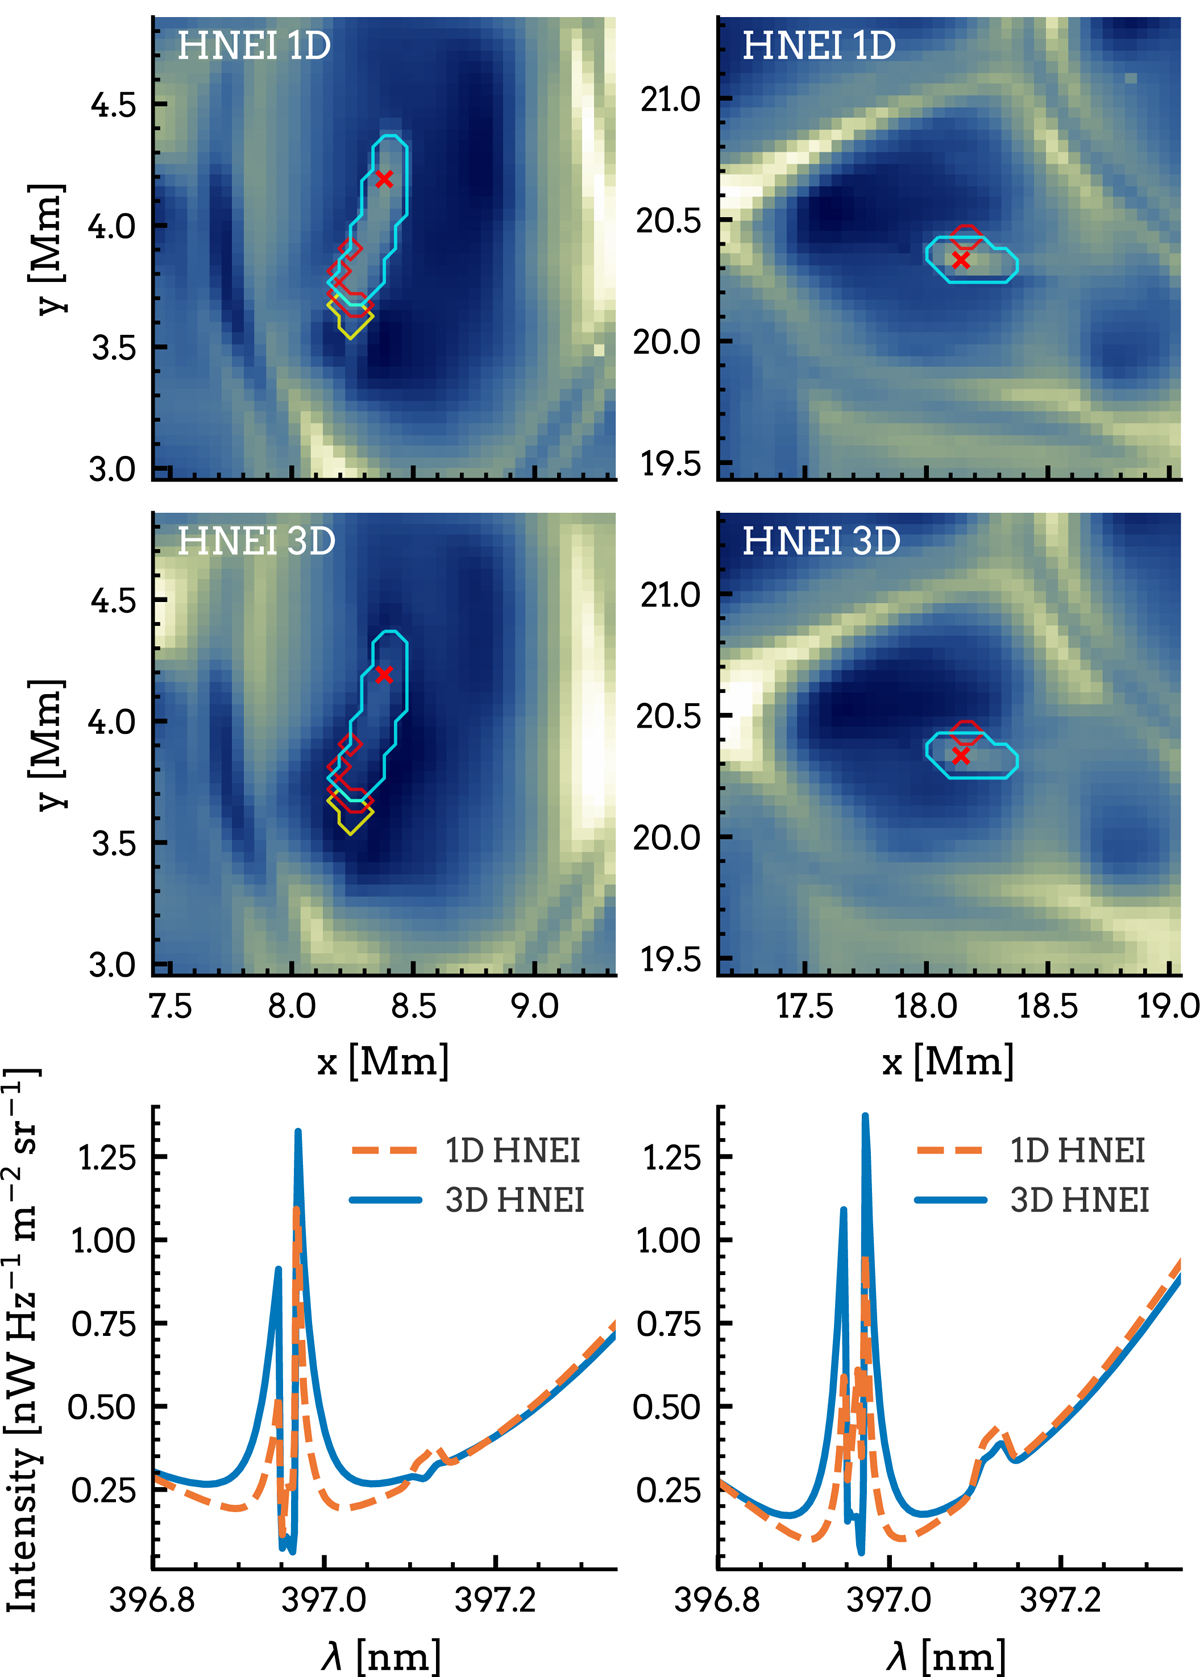
Synthetic Ca II H and Hε images and spectral profiles for Hε emission formed at low mass densities. Top two rows: synthesized Hε line core images from a cutout of the Bifrost simulation calculated in 1D (top row) and 3D (middle row). Contours mark column mass regions, same as in Fig. 6. Bottom row: Ca II H plus Hε spectral profiles from locations marked with red crosses in the Hε line core images.
Current usage metrics show cumulative count of Article Views (full-text article views including HTML views, PDF and ePub downloads, according to the available data) and Abstracts Views on Vision4Press platform.
Data correspond to usage on the plateform after 2015. The current usage metrics is available 48-96 hours after online publication and is updated daily on week days.
Initial download of the metrics may take a while.