Fig. 10.
Download original image
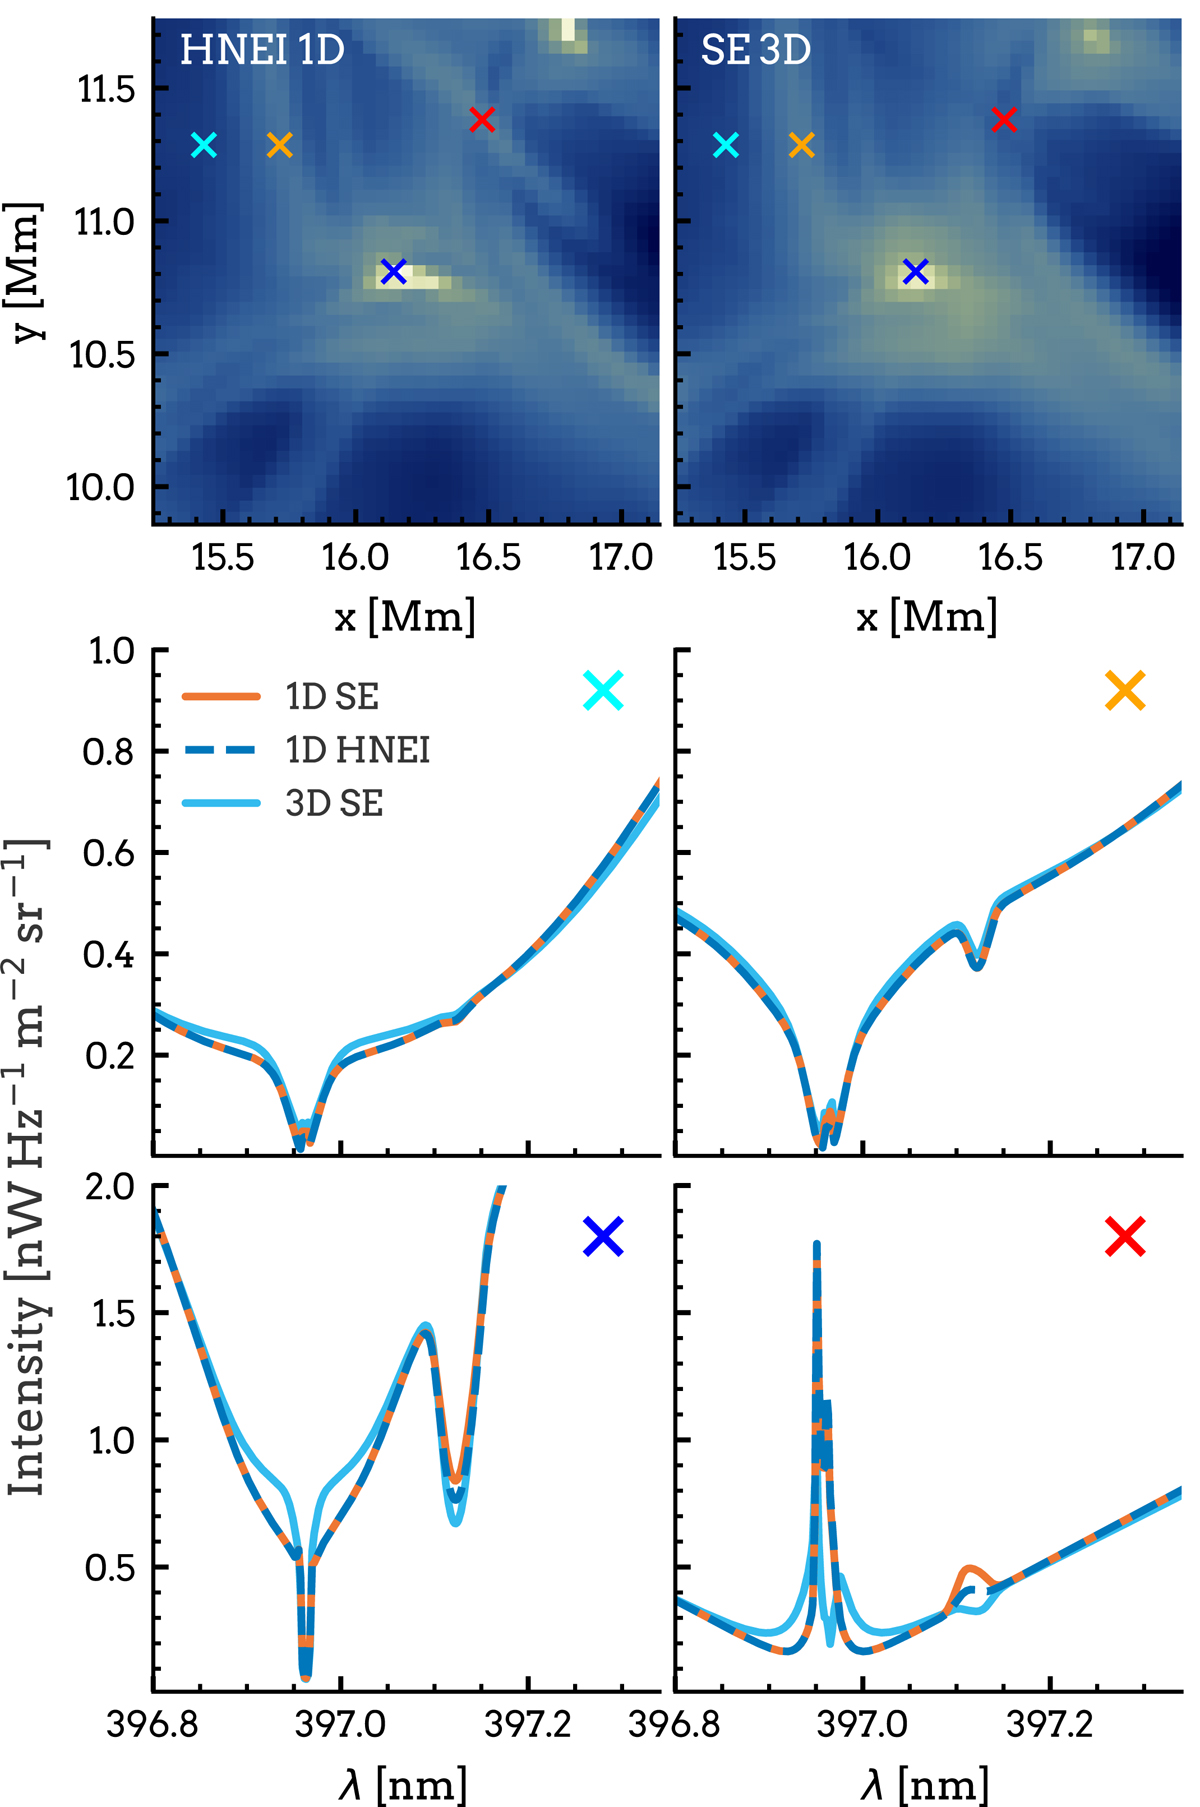
Synthetic Ca II H and Hε images and spectral profiles for reversed granulation, magnetic elements, and a dark fibrilar structure. Topmost row: synthesized Hε line core images from a cutout of the Bifrost simulation calculated in 1D (left) and 3D (right). Bottom two rows: Ca II H plus Hε spectral profiles from locations marked with coloured crosses in the Hε line core images. Middle-left: granular spectral profile. Middle-right: intergranular spectral profile. Bottom-left: spectral profile located at a magnetic field concentration. Bottom-right: location where Hε emission in 1D turns to absorption in 3D.
Current usage metrics show cumulative count of Article Views (full-text article views including HTML views, PDF and ePub downloads, according to the available data) and Abstracts Views on Vision4Press platform.
Data correspond to usage on the plateform after 2015. The current usage metrics is available 48-96 hours after online publication and is updated daily on week days.
Initial download of the metrics may take a while.