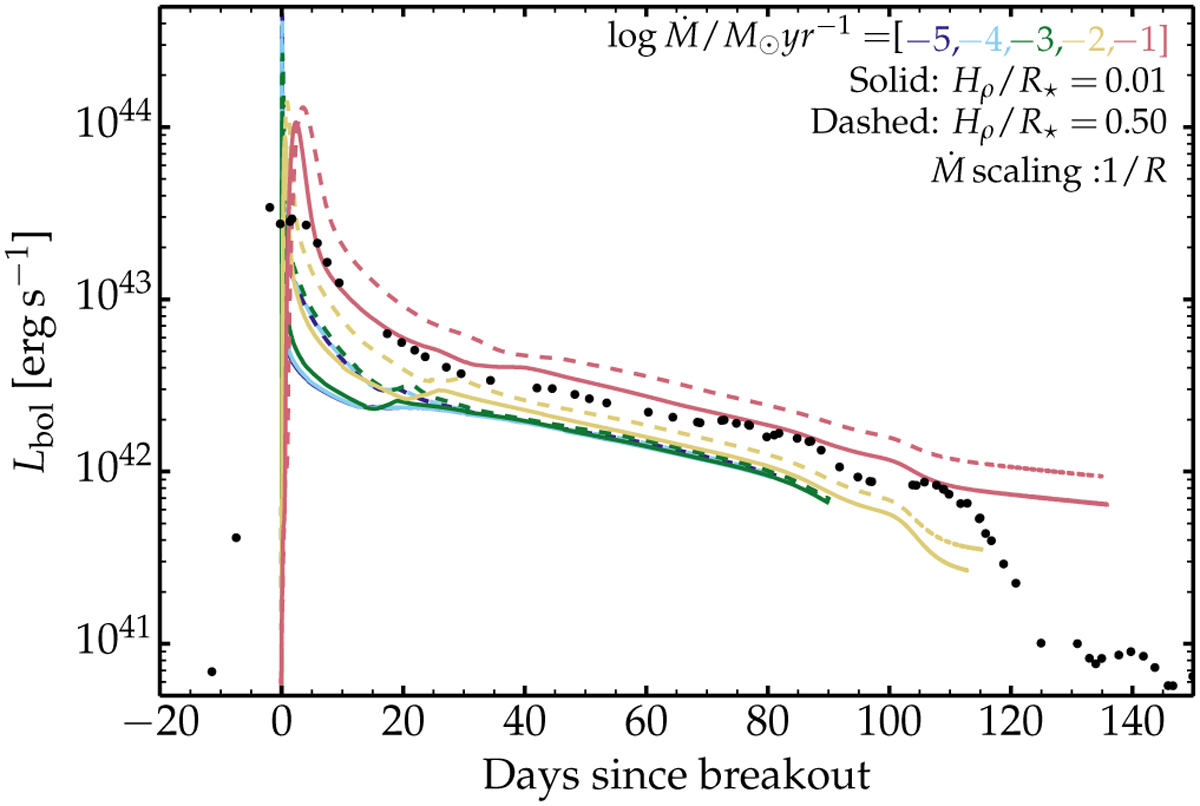
Fig. A.1
Download original image
HERACLES light curves for different ejecta-CSM configurations. We compare the bolometric light curves obtained with HERACLES for ejecta-CSM configurations corresponding to case-(1) and case-(2), as described in Section 2.1. We limit the sample for wind mass-loss rates covering from 10−5 to 0.1 M⊙ yr−1 with an additional density scaling of 1/R. The light curve degeneracy discussed in Sect. 3 is present throughout the sampled mass-loss rate range. Filled dots correspond to the inferred values for SN 2020tlf (Jacobson-Galán et al. 2022).
Current usage metrics show cumulative count of Article Views (full-text article views including HTML views, PDF and ePub downloads, according to the available data) and Abstracts Views on Vision4Press platform.
Data correspond to usage on the plateform after 2015. The current usage metrics is available 48-96 hours after online publication and is updated daily on week days.
Initial download of the metrics may take a while.