Fig. 3
Download original image
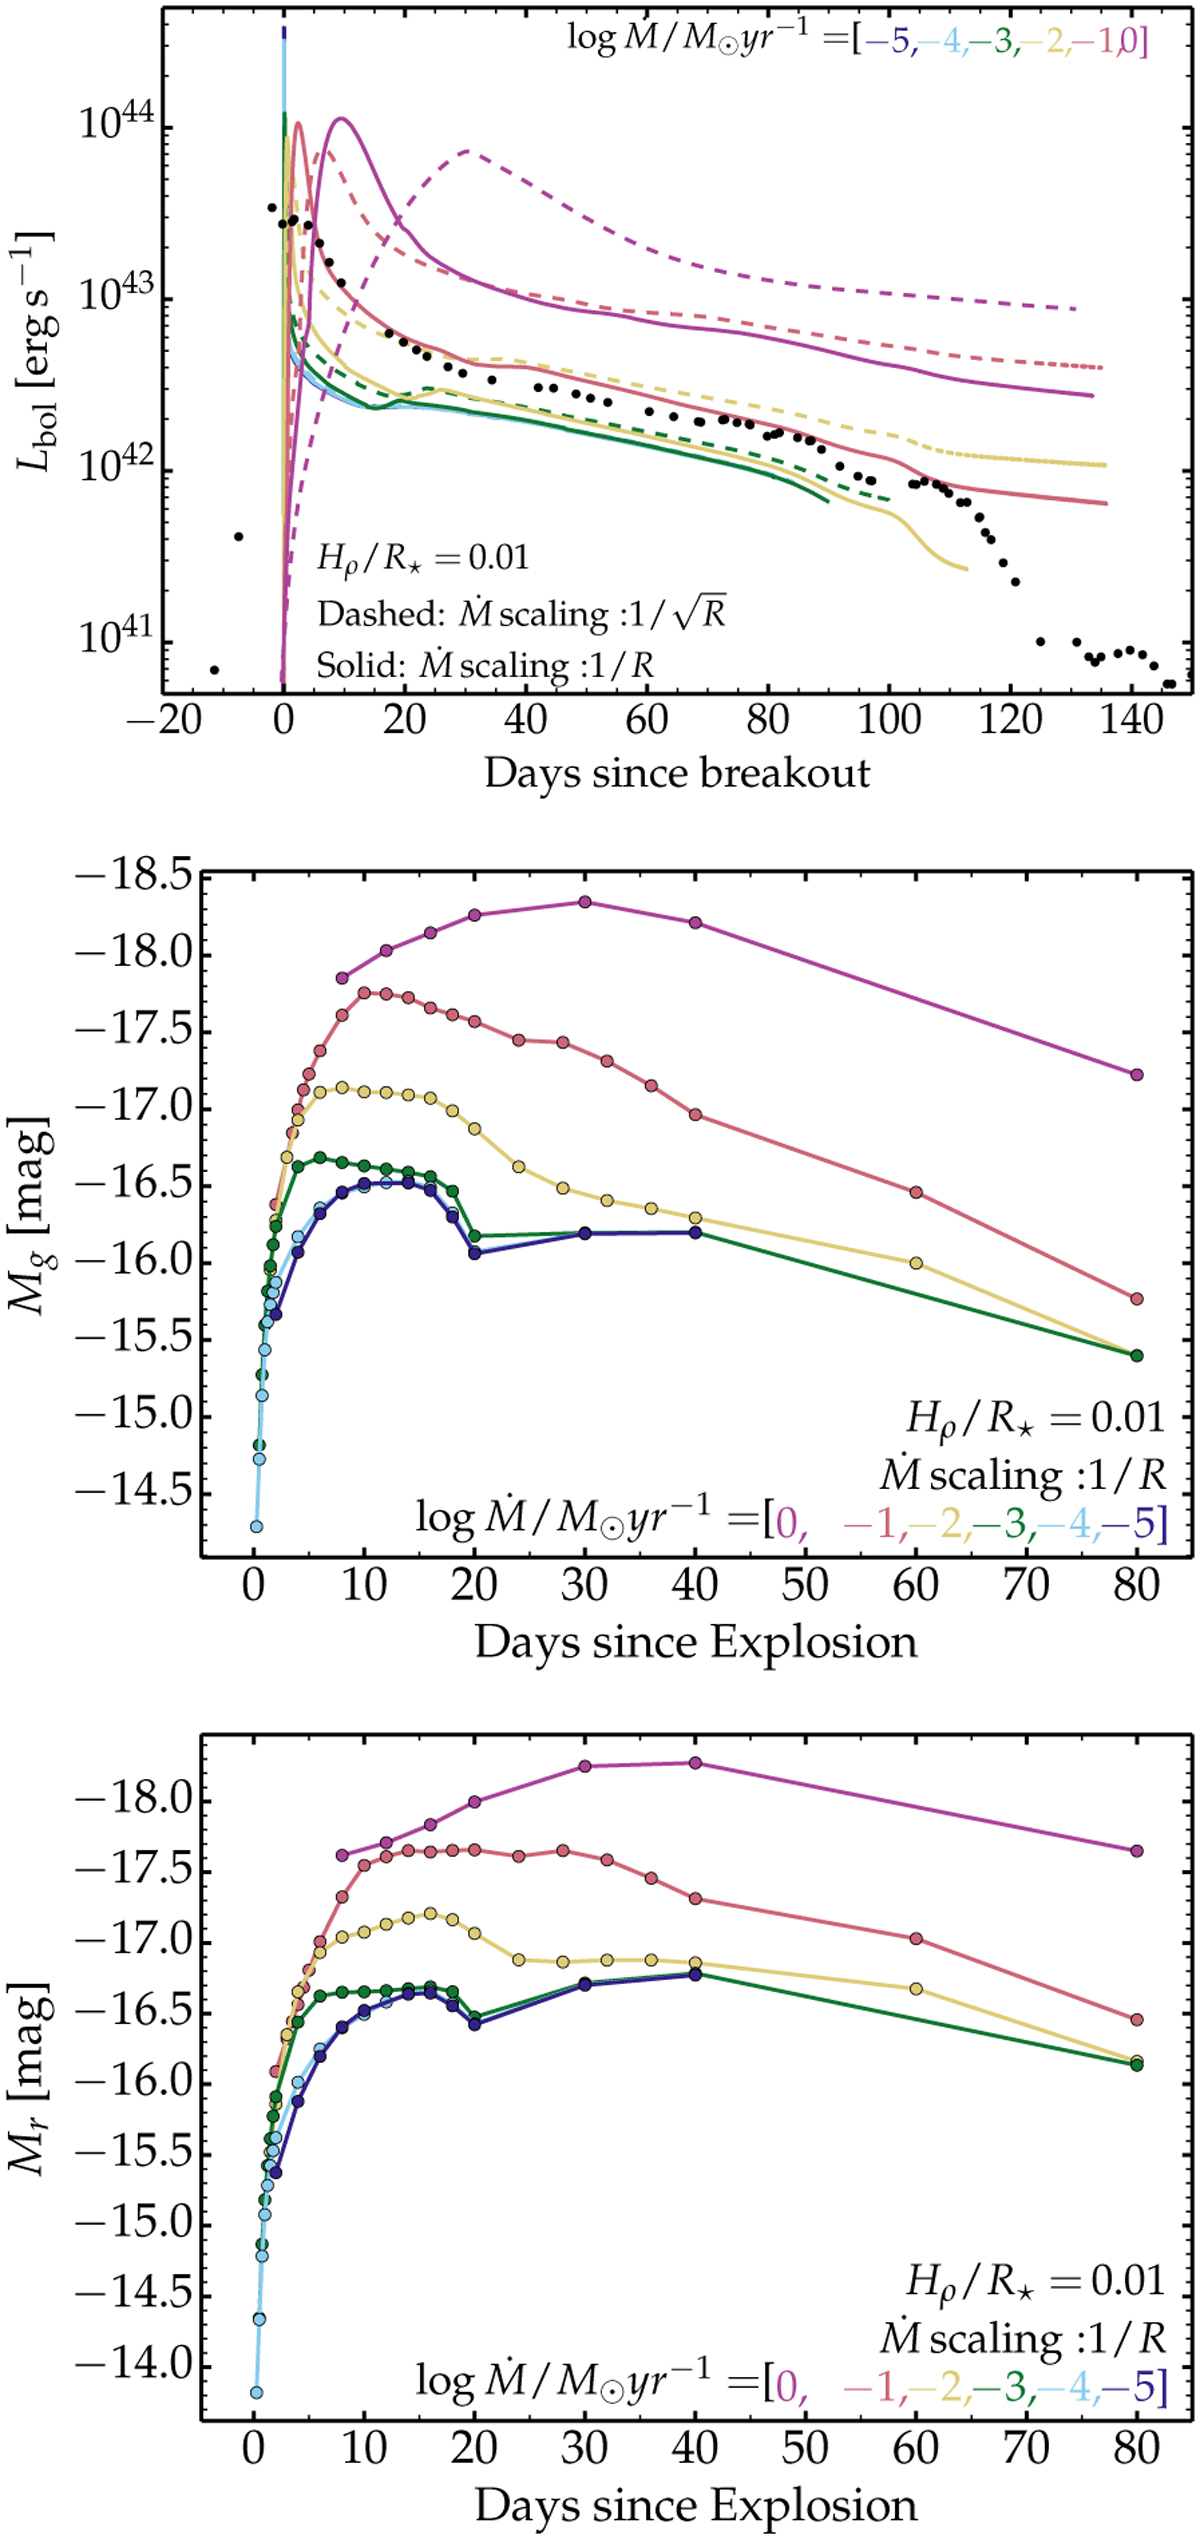
Photometric properties of simulations corresponding to Case-(1) CSM configurations. Top panel: HERACLES bolometric light curves for wind mass-loss rates covering from 10−5 up to 1 M⊙ yr−1 with an additional density scaling of 1/R (solid) and ![]() (dashed). Filled dots correspond to the inferred values for SN 2020tlf (Jacobson-Galán et al. 2022). Simulations using a lower wind density are truncated at late times because of a numerical problem when the shock reaches the outer grid boundary. Middle and bottom panels: g (middle) and r-band (bottom) light curves computed with CMFGEN and based on the HERACLES simulations for interaction models with an atmospheric scale height of 0.01 R⋆, wind mass-loss rates between 10−5 and 1 M⊙ yr−1, and an additional scaling of the wind density by a factor of 1/R.
(dashed). Filled dots correspond to the inferred values for SN 2020tlf (Jacobson-Galán et al. 2022). Simulations using a lower wind density are truncated at late times because of a numerical problem when the shock reaches the outer grid boundary. Middle and bottom panels: g (middle) and r-band (bottom) light curves computed with CMFGEN and based on the HERACLES simulations for interaction models with an atmospheric scale height of 0.01 R⋆, wind mass-loss rates between 10−5 and 1 M⊙ yr−1, and an additional scaling of the wind density by a factor of 1/R.
Current usage metrics show cumulative count of Article Views (full-text article views including HTML views, PDF and ePub downloads, according to the available data) and Abstracts Views on Vision4Press platform.
Data correspond to usage on the plateform after 2015. The current usage metrics is available 48-96 hours after online publication and is updated daily on week days.
Initial download of the metrics may take a while.