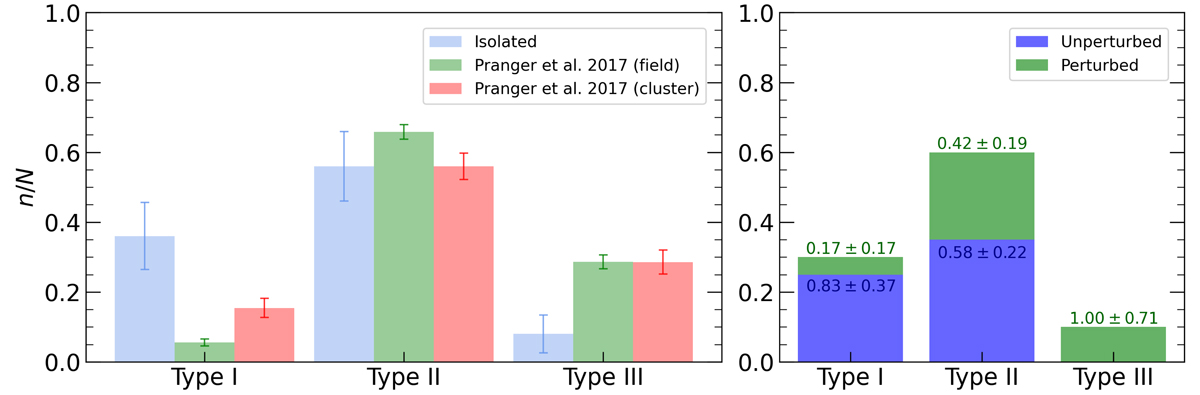
Fig. 5.
Download original image
Frequency of the disc break type and the interaction signatures of our sample of galaxies. Left: normalised distribution of the frequency of the types of breaks found in this work (left, blue) and in Pranger et al. (2017) for their field (middle, green) and cluster (right, red) samples. Right: normalised distribution of the frequency of the types of breaks. Galaxies that are strongly contaminated by cirrus are excluded from this figure. We also show the contribution of unperturbed (blue) and perturbed (green) galaxies for each type of break.
Current usage metrics show cumulative count of Article Views (full-text article views including HTML views, PDF and ePub downloads, according to the available data) and Abstracts Views on Vision4Press platform.
Data correspond to usage on the plateform after 2015. The current usage metrics is available 48-96 hours after online publication and is updated daily on week days.
Initial download of the metrics may take a while.