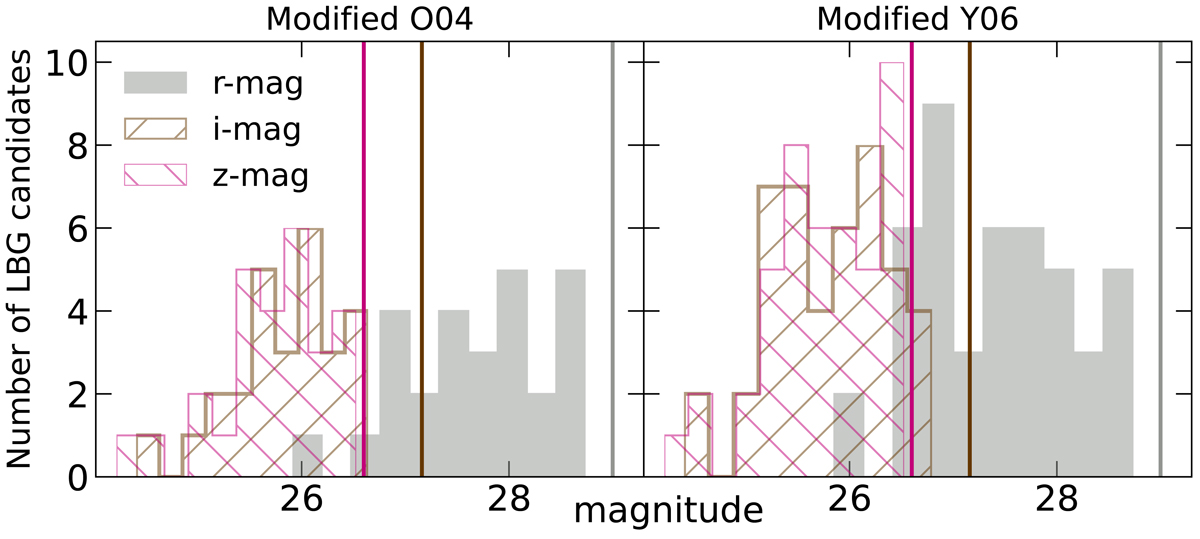
Fig. 8.
Download original image
Left and right panels show the magnitude distribution of the LBG candidates selected with the modified O04 and Y06 selection criteria, respectively, in each band. The r-band magnitude distributions only show the LBG candidates that are brighter than the 1σ limit. The three vertical lines are the 3σ magnitude limit for the i-band (brown) and z-band (purple) and the 1σ magnitude limit for the r-band (grey).
Current usage metrics show cumulative count of Article Views (full-text article views including HTML views, PDF and ePub downloads, according to the available data) and Abstracts Views on Vision4Press platform.
Data correspond to usage on the plateform after 2015. The current usage metrics is available 48-96 hours after online publication and is updated daily on week days.
Initial download of the metrics may take a while.