Fig. 5.
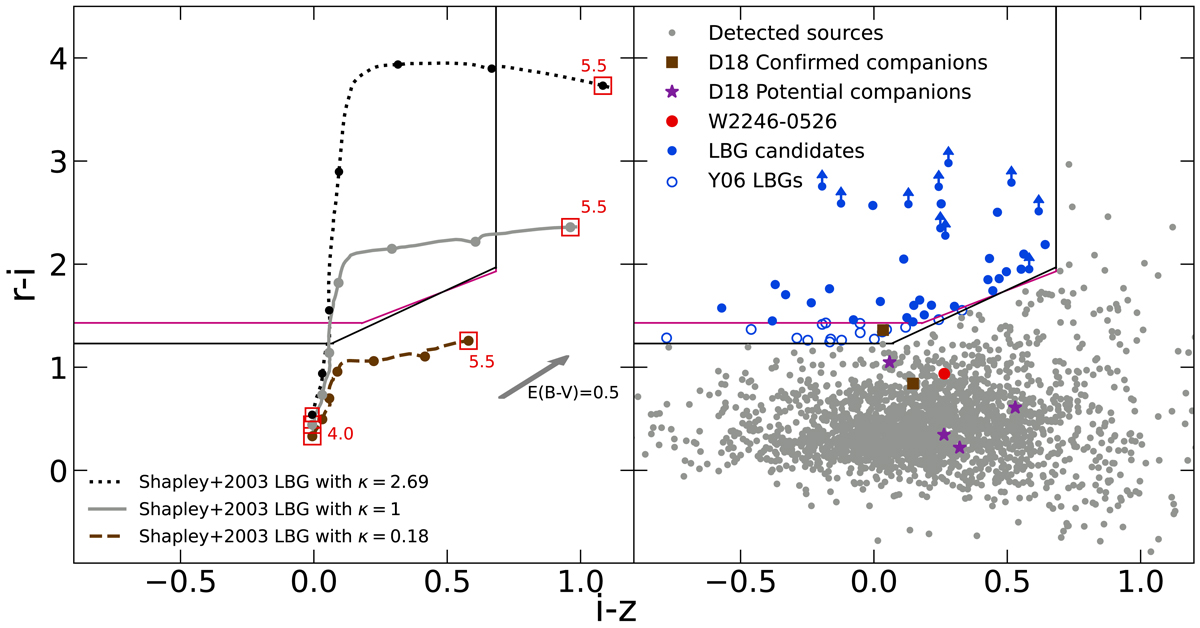
Download original image
Left panel: Color-redshift track of the LBG composite spectrum of Shapley et al. (2003) with the IGM absorption of Madau (1995) as described in Eq. (2) for values of κ = 2.69 (dotted black line), 1.0 (solid grey line), and 0.18 (dashed brown line). The open red squares mark the z = 4.0 and z = 5.5 endpoints of each color-redshift track. The dots in each track indicates Δz = 0.25 bins. Right panel: Distribution of the r − i and i − z colors of sources around W2246−0526 (grey dots). The blue-filled circles show the LBG candidates identified by both the O04 and Y06 selection criteria. The blue open circles show the LBG candidates identified by only the Y06 selection criteria. The spectroscopically confirmed (brown squares) and potential (purple star) companions from Díaz-Santos et al. (2018) are also shown, and the red dot shows the Hot DOG. Ten of the identified LBG candidates are fainter than 1σ in the r-band, and hence their (r − i) Colors are shown as lower limits.
Current usage metrics show cumulative count of Article Views (full-text article views including HTML views, PDF and ePub downloads, according to the available data) and Abstracts Views on Vision4Press platform.
Data correspond to usage on the plateform after 2015. The current usage metrics is available 48-96 hours after online publication and is updated daily on week days.
Initial download of the metrics may take a while.