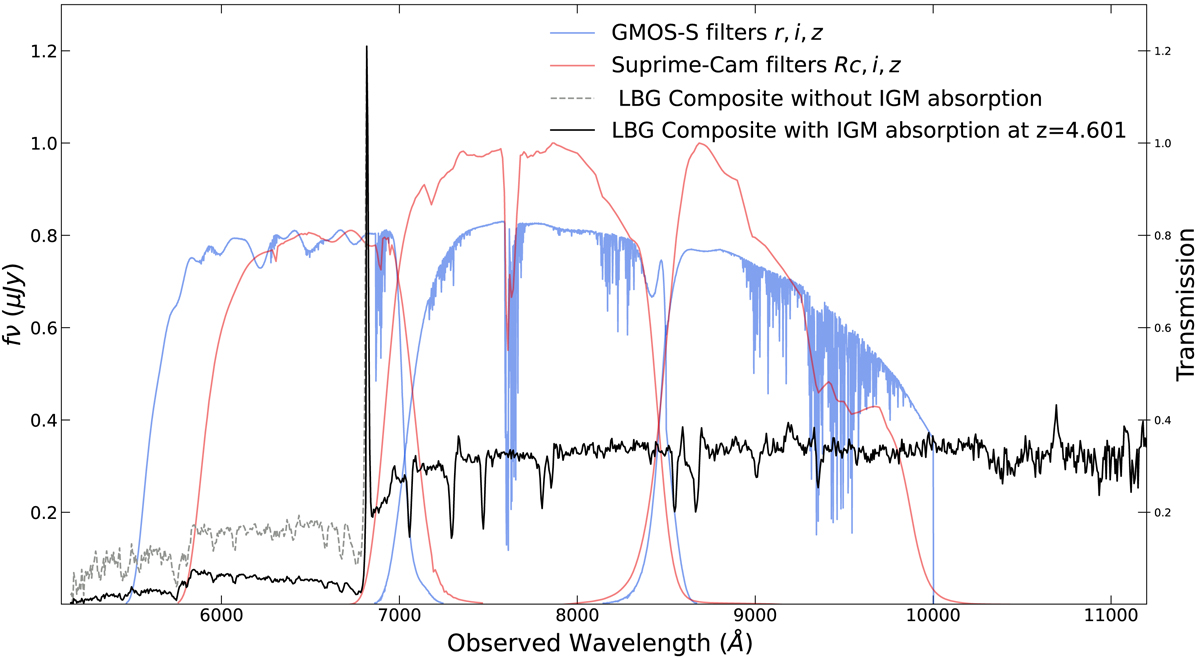
Fig. 3.
Download original image
Composite LBG spectrum of Shapley et al. (2003), with the IGM absorption at z = 3 and shifted to z = 4.601 (grey-shaded line), and the IGM absorption correction at z = 4.6 (black-solid line). See text for further details. After accounting for quantum efficiency and atmospheric transmission, the blue and the red solid line are the GMOS-S (used in this work) and Subaru Suprime-cam filter curves, respectively.
Current usage metrics show cumulative count of Article Views (full-text article views including HTML views, PDF and ePub downloads, according to the available data) and Abstracts Views on Vision4Press platform.
Data correspond to usage on the plateform after 2015. The current usage metrics is available 48-96 hours after online publication and is updated daily on week days.
Initial download of the metrics may take a while.