Open Access
Fig. 2.
Download original image
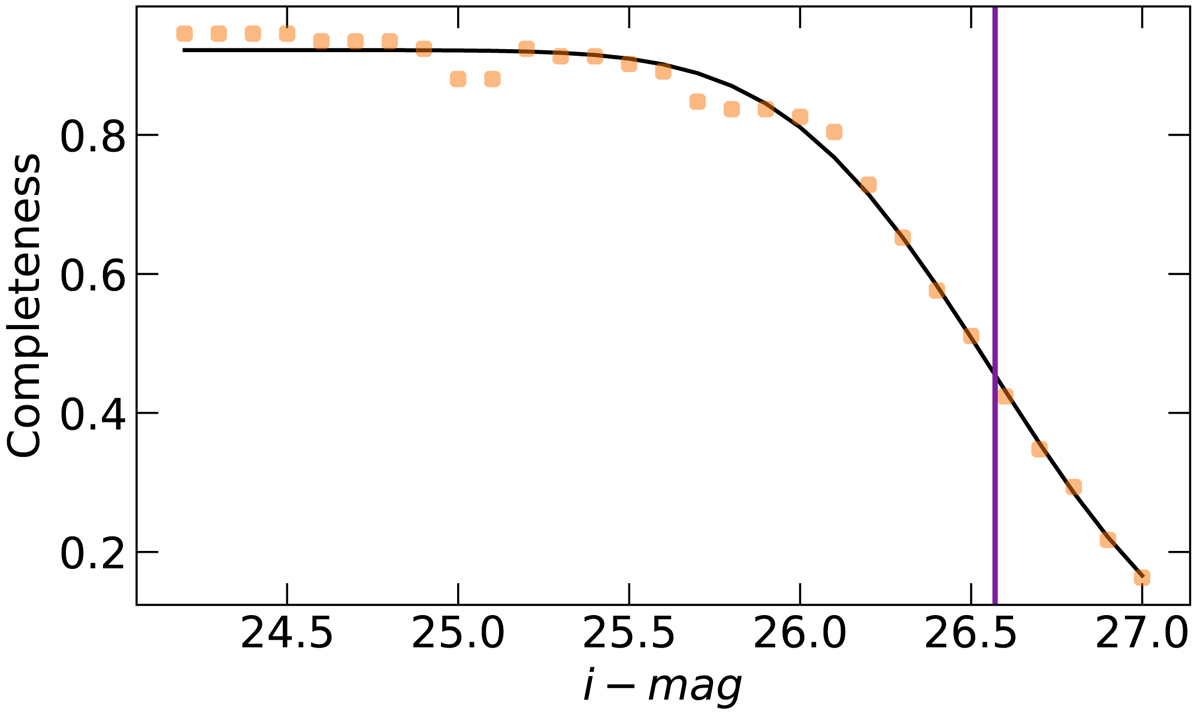
Detection completeness in the i-band image. The dots show the completeness as a function of the apparent magnitudes in the i-band solid black line shows the best fit to the detection completeness. The vertical purple line shows the 3σ limit of our z-band observation.
Current usage metrics show cumulative count of Article Views (full-text article views including HTML views, PDF and ePub downloads, according to the available data) and Abstracts Views on Vision4Press platform.
Data correspond to usage on the plateform after 2015. The current usage metrics is available 48-96 hours after online publication and is updated daily on week days.
Initial download of the metrics may take a while.