Fig. 11.
Download original image
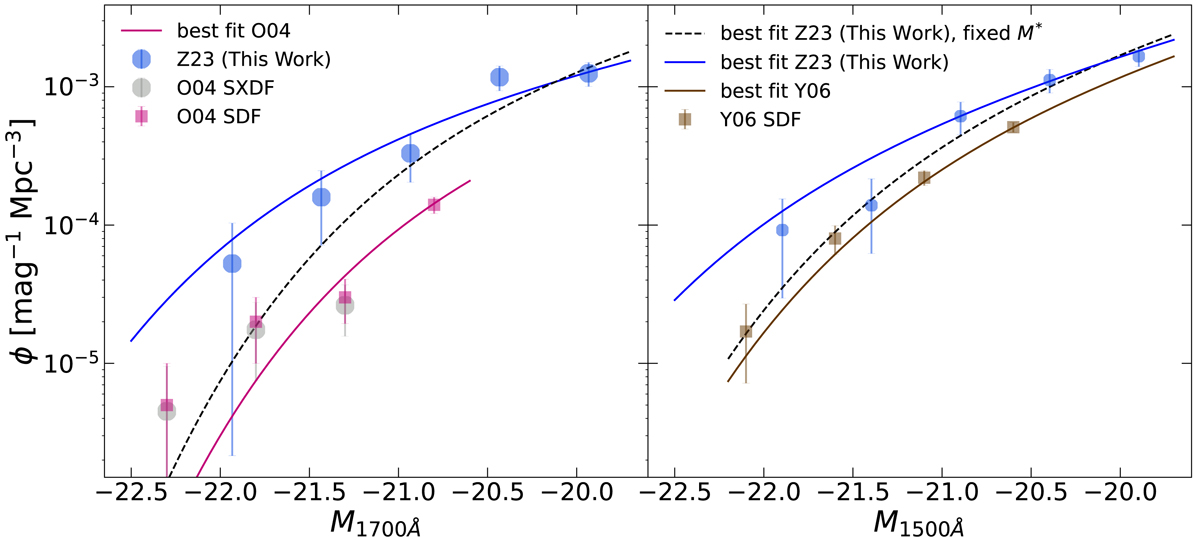
UV luminosity functions of the LBGs at z ∼ 4.6. The blue circles are selected LBG candidates around the Hot DOGs. The magenta and brown rectangles are from O04 and Y06, respectively. The solids line shows the best-fit Schechter function for each study and the black dashed lines show the best fit by fixing the M* and α based on the result of O04 and Y06.
Current usage metrics show cumulative count of Article Views (full-text article views including HTML views, PDF and ePub downloads, according to the available data) and Abstracts Views on Vision4Press platform.
Data correspond to usage on the plateform after 2015. The current usage metrics is available 48-96 hours after online publication and is updated daily on week days.
Initial download of the metrics may take a while.