Fig. 9
Download original image
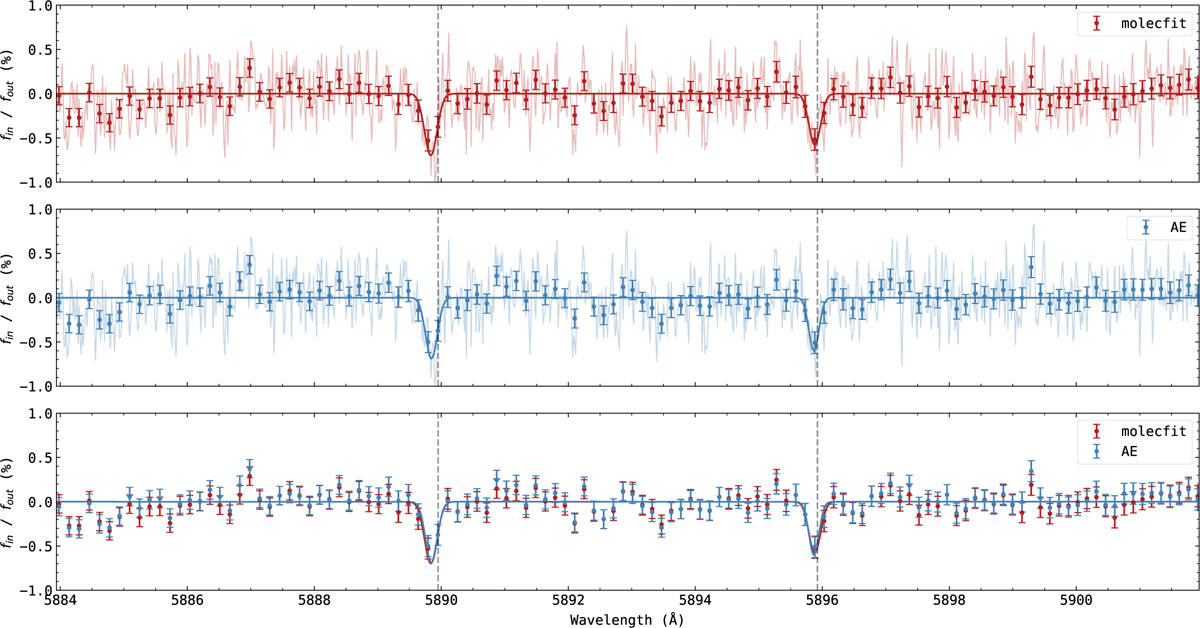
Transmission spectroscopy for the Na I doublet. The spectroscopy is performed using molecfit corrected spectra (top panel, red) and Autoencoder corrected spectra (middle panel, blue). The unbinned transmission spectra from either approach is shown in respectively light red and light blue while the binned master transmission spectra are shown as solid red and solid blue error bars. Each master transmission spectrum is fitted with a Gaussian model (solid red and solid blue lines). The vertical dotted gray lines show the theoretical location of each spectral line. The bottom panel shows a direct comparison of the binned master transmission spectra and the Gaussian models from either molecfit and TAU.
Current usage metrics show cumulative count of Article Views (full-text article views including HTML views, PDF and ePub downloads, according to the available data) and Abstracts Views on Vision4Press platform.
Data correspond to usage on the plateform after 2015. The current usage metrics is available 48-96 hours after online publication and is updated daily on week days.
Initial download of the metrics may take a while.