Open Access
Fig. 3
Download original image
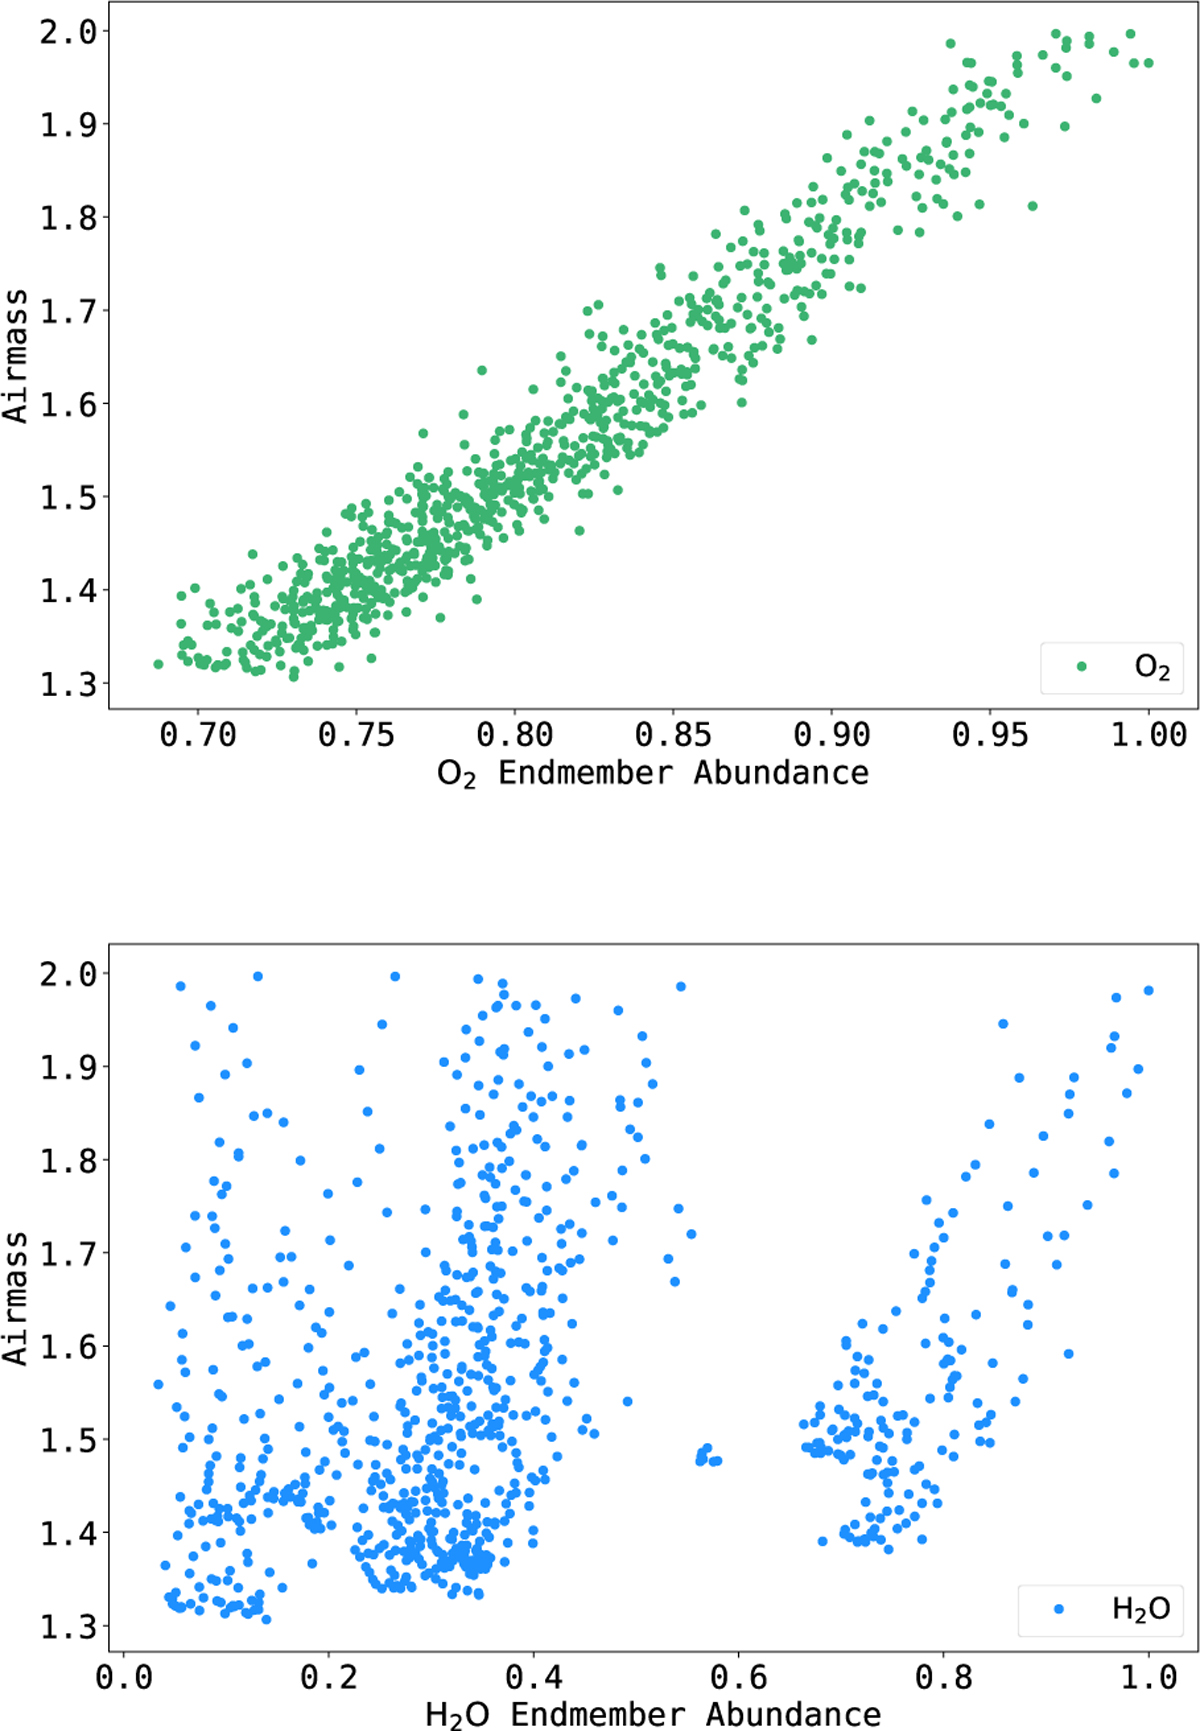
Scatter plots of airmass and the telluric abundances learned by the autoencoder for order 60 of the HARPS-N solar observations. The O2 endmember abundances (top, green) show a clear linear relationship with airmass, while the H2O endmember abundances (bottom, blue) show a much weaker correlation with airmass.
Current usage metrics show cumulative count of Article Views (full-text article views including HTML views, PDF and ePub downloads, according to the available data) and Abstracts Views on Vision4Press platform.
Data correspond to usage on the plateform after 2015. The current usage metrics is available 48-96 hours after online publication and is updated daily on week days.
Initial download of the metrics may take a while.