Open Access
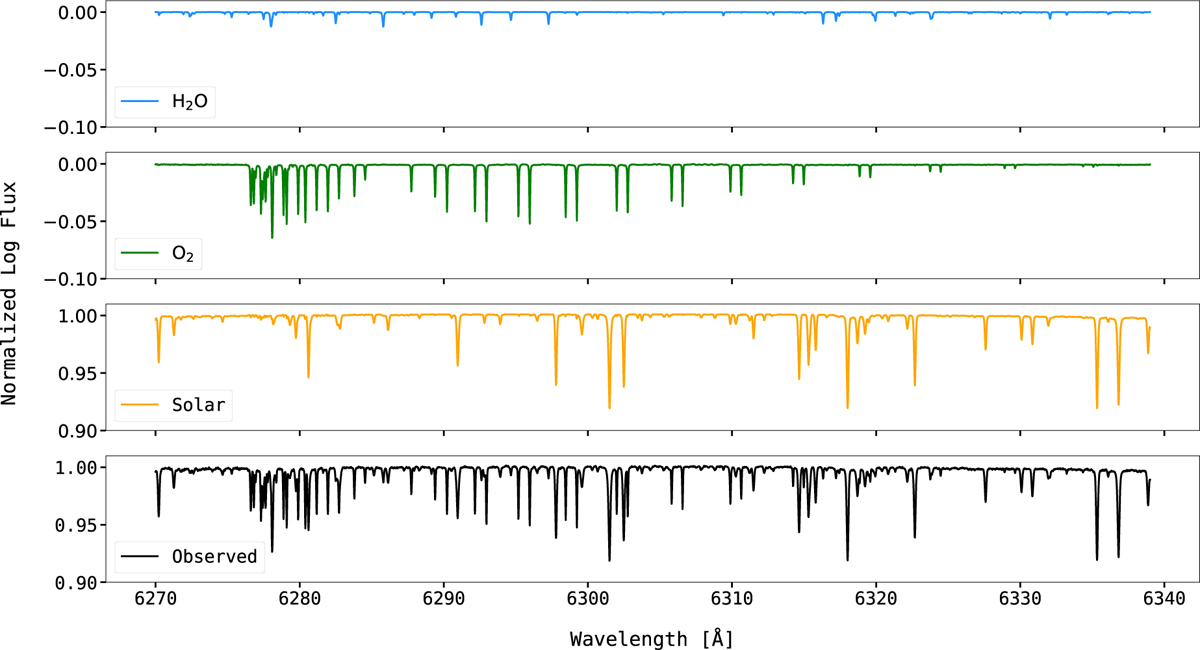
Fig. 2
Download original image
Illustration of the extracted endmembers and an observed solar spectrum for order 60. The extracted endmembers represent from top to bottom the H2O (blue, top), O2 (green) and solar (orange) components of the observed spectrum (black, bottom).
Current usage metrics show cumulative count of Article Views (full-text article views including HTML views, PDF and ePub downloads, according to the available data) and Abstracts Views on Vision4Press platform.
Data correspond to usage on the plateform after 2015. The current usage metrics is available 48-96 hours after online publication and is updated daily on week days.
Initial download of the metrics may take a while.