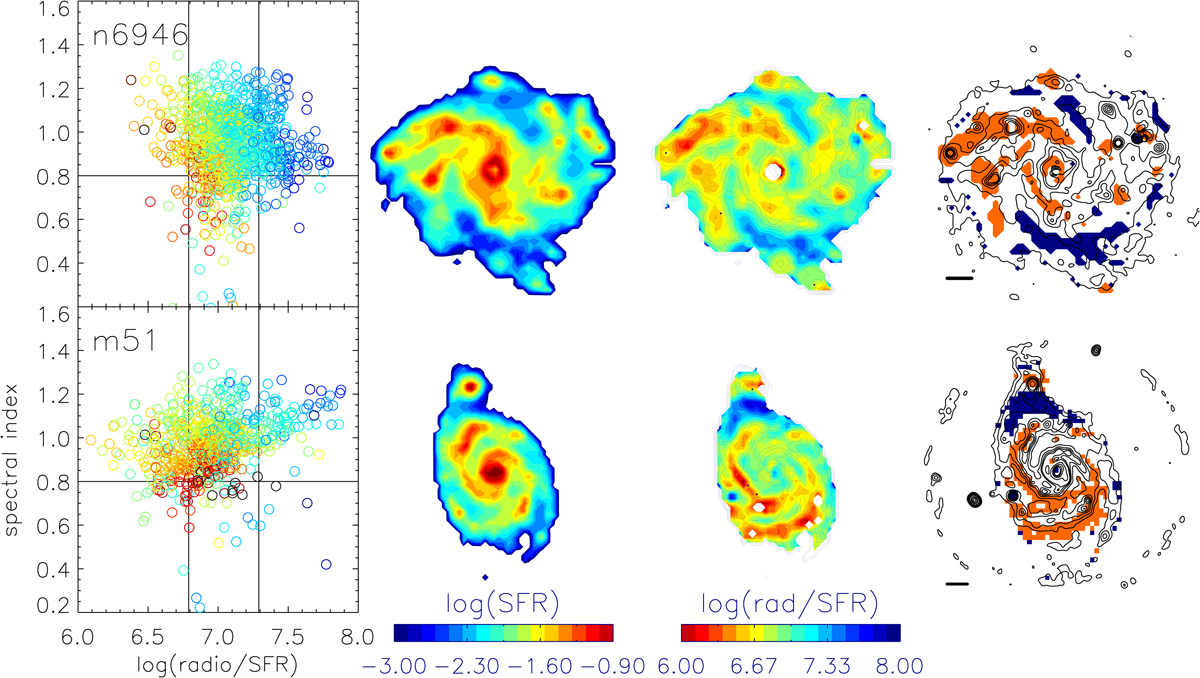
Fig. 3.
Download original image
Relation between the spectral index and radio-bright and radio-dim regions. From left to right: (i) spectral index as a function of the ratio between the radio surface brightness and the star formation rate per unit area, the colors correspond to the star formation rate per unit area (red corresponds to high values); (ii) star formation rate per unit area (M⊙ kpc−2 yr−1); (iii) star formation rate per unit area (contours) on the ratio between the radio continuum surface brightness (Jy/sr) and the star formation rate per unit area (color); (iv) radio continuum surface brightness (contours) on the radio-dim (red) and radio-bright (blue) regions. The radio continuum contour levels are (1, 2, 4, 6, 8, 10, 20, 30, 40, 50)×200 μJy beam−1. The horizontal lines correspond to a size of 1′.
Current usage metrics show cumulative count of Article Views (full-text article views including HTML views, PDF and ePub downloads, according to the available data) and Abstracts Views on Vision4Press platform.
Data correspond to usage on the plateform after 2015. The current usage metrics is available 48-96 hours after online publication and is updated daily on week days.
Initial download of the metrics may take a while.