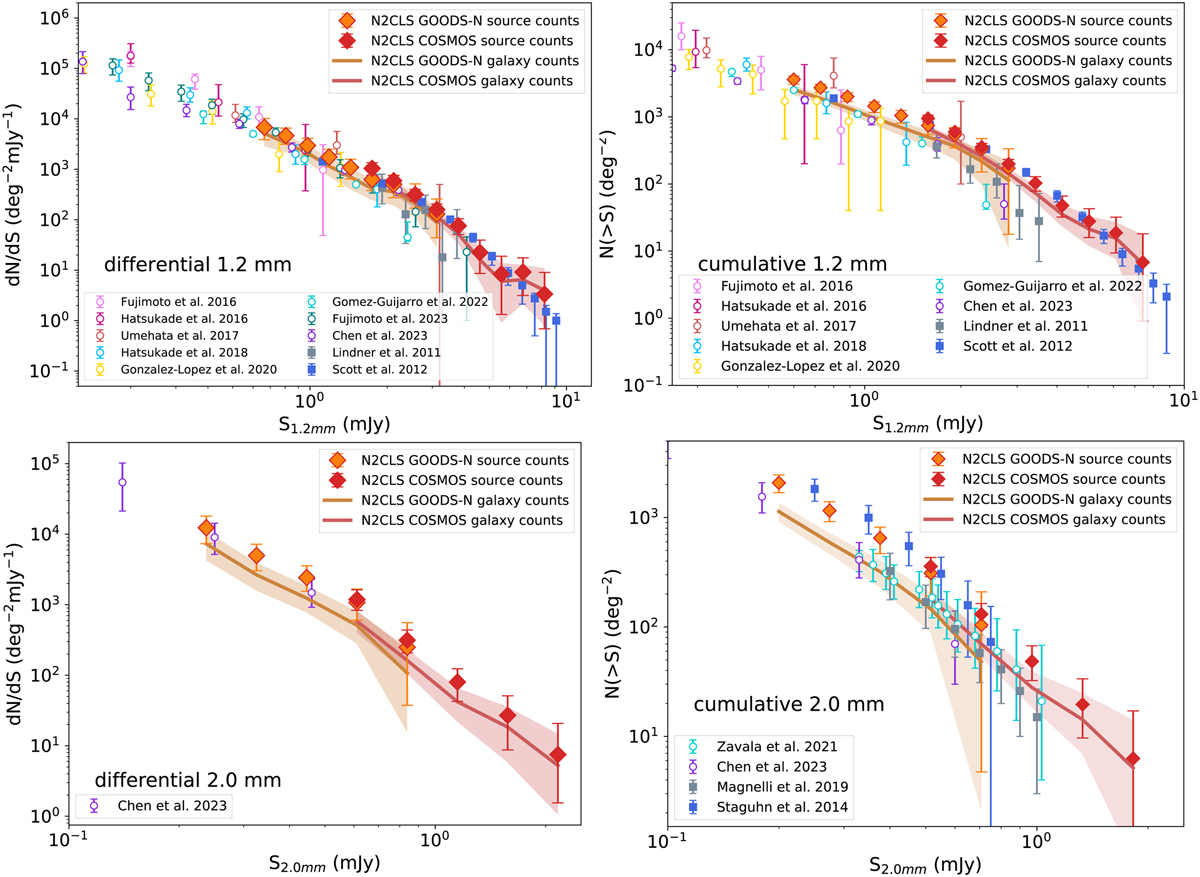
Fig. 8
Download original image
Comparison between N2CLS GOODS-N (orange diamonds) and COSMOS (red diamonds) source number counts at 1.2 mm (top panels) and 2 mm (bottom panels). Differential and cumulative number counts are presented in the left and right panels, respectively. In each panel, the N2CLS galaxy number counts (see Sect. 4.3) and the corresponding 1 σ confidence interval are represented using red (COSMOS) and orange (GOODS-N) solid lines and shaded regions. All results from interferometric observations at 1.1 or 1.2 mm (Fujimoto et al. 2016, 2023; Hatsukade et al. 2016, 2018; Umehata et al. 2017; González-López et al. 2020; Gómez-Guijarro et al. 2022a; Chen et al. 2023) and 2 mm (Zavala et al. 2021; Chen et al. 2023) are shown as open circles. The measurements from single-dish observations at 1.1 or 1.2 mm (Lindner et al. 2011; Scott et al. 2012) and 2 mm (Staguhn et al. 2014; Magnelli et al. 2019) are represented by filled squares.
Current usage metrics show cumulative count of Article Views (full-text article views including HTML views, PDF and ePub downloads, according to the available data) and Abstracts Views on Vision4Press platform.
Data correspond to usage on the plateform after 2015. The current usage metrics is available 48-96 hours after online publication and is updated daily on week days.
Initial download of the metrics may take a while.