Fig. 7
Download original image
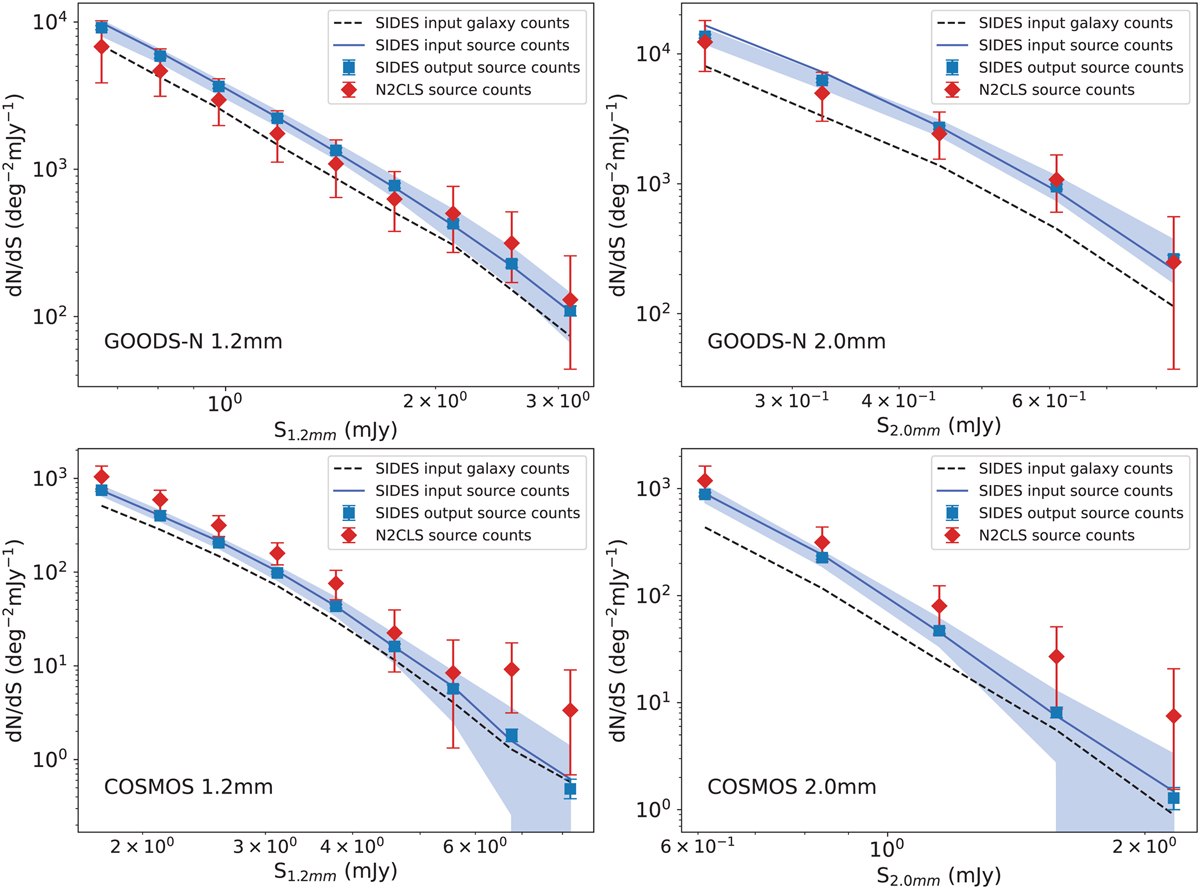
Comparison between the differential number counts from simulations and observations at 1.2 mm (left panels) and 2 mm (right panels) in GOODS-N (upper panels) and COSMOS (lower panels). The solid blue line represents the source number counts derived directly from SIDES noiseless maps (see Sect. 4.2), while the blue squares are the source number counts estimated using the full analysis pipeline (map making, source extraction, and statistical corrections). These are the input and output source number counts from the simulation. The blue shaded area illustrates the 1σ field-to-field variance of the output source number counts. As several galaxies can contribute to a source, we also show the galaxy number counts in SIDES as the black dashed line in the figure (see discussion in Sect. 4.3). Finally, the number counts measured from N2CLS are represented by red diamonds.
Current usage metrics show cumulative count of Article Views (full-text article views including HTML views, PDF and ePub downloads, according to the available data) and Abstracts Views on Vision4Press platform.
Data correspond to usage on the plateform after 2015. The current usage metrics is available 48-96 hours after online publication and is updated daily on week days.
Initial download of the metrics may take a while.