Fig. 6
Download original image
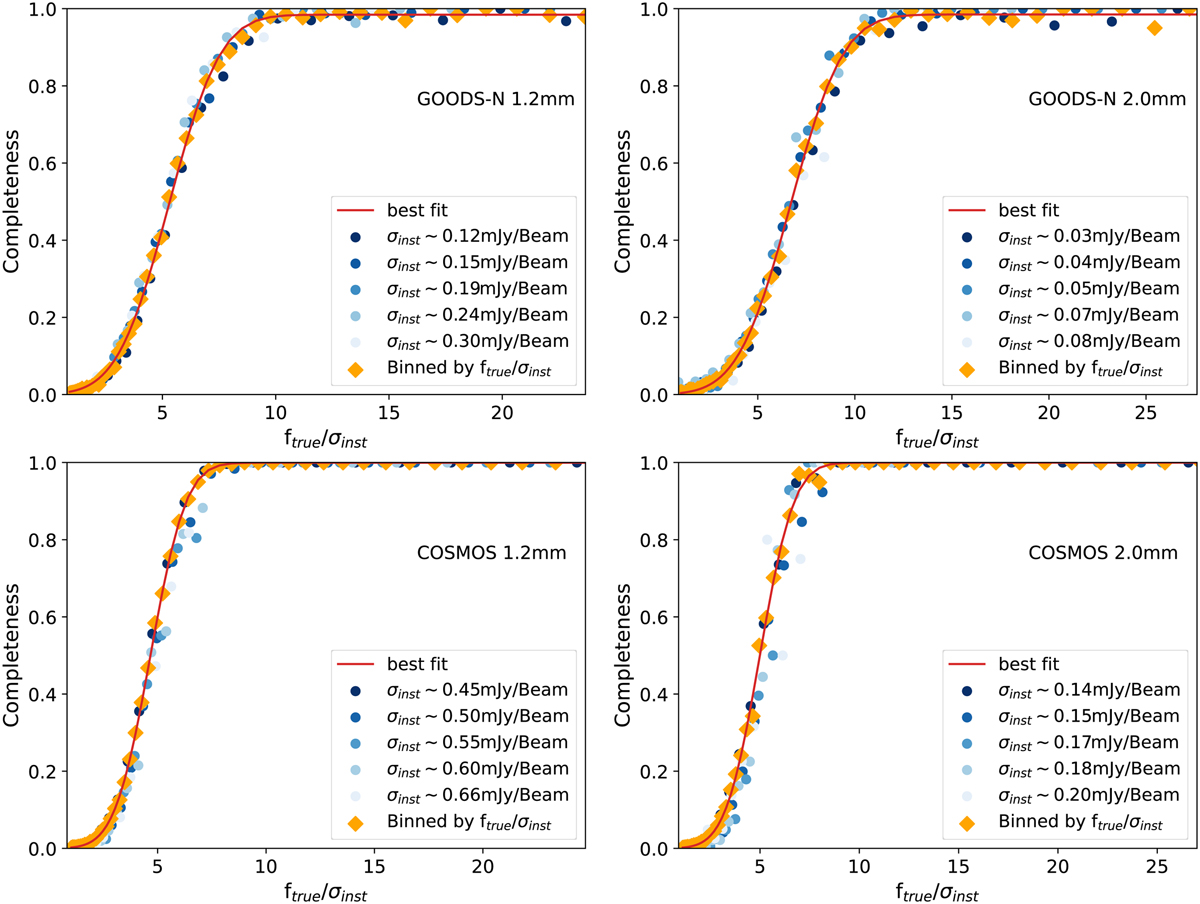
Completeness of sources in N2CLS as a function of the ratio between source flux density and instrumental noise level (ftrue/σinst) at 1.2 mm (left panels) and 2 mm (right panels) in GOODS-N (upper panels) and COSMOS (lower panels). The completeness in various survey areas with different instrumental noise levels is presented as bluish color-coded dots, and the average completeness over the whole survey area is shown using oranges dots. The red line shows the best fit of the average completeness using the functional form of Eq. (3).
Current usage metrics show cumulative count of Article Views (full-text article views including HTML views, PDF and ePub downloads, according to the available data) and Abstracts Views on Vision4Press platform.
Data correspond to usage on the plateform after 2015. The current usage metrics is available 48-96 hours after online publication and is updated daily on week days.
Initial download of the metrics may take a while.