Fig. 5
Download original image
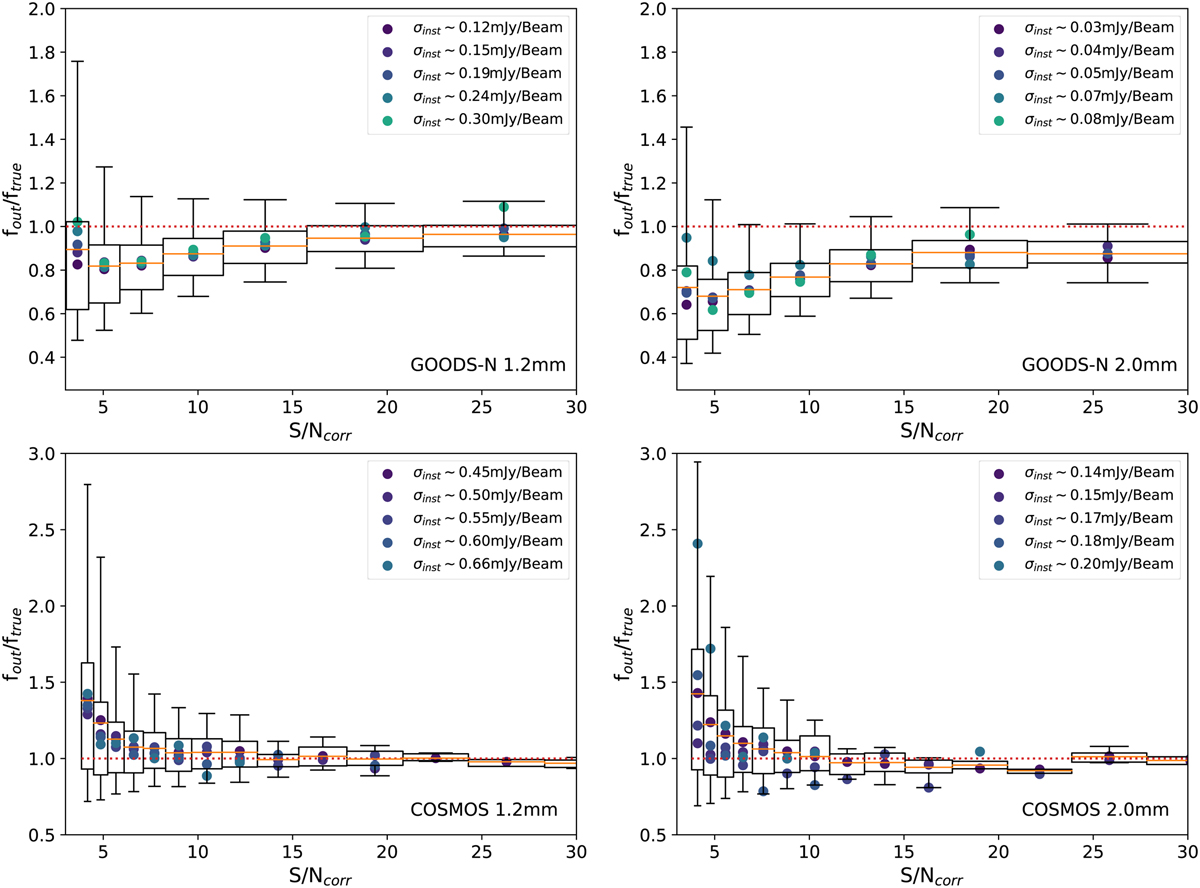
Ratio between the source fluxes measured in the output simulated maps (fout) and the source fluxes from the input blob catalog (ftrue) as functions of S/N at 1.2 mm (left panels) and 2 mm (right panels) in GOODS-N (upper panels) and COSMOS (lower panels). This corresponds to the effective flux boosting described in Sect. 3.3. The boxes shown for each S/N bin represent ranges between 25% and 75% of the cumulative distribution and the upper and lower bounds of error bars present 5% to 95% of the cumulative distribution (within 1σ). The width of each box corresponds to the width of the corresponding S/Ncorr bin. The red dotted line shows the position of unity effective flux boosting as a reference for each plot. In addition, we use color-coded solid-filled circles to present the median flux boosting in regions with different noise levels.
Current usage metrics show cumulative count of Article Views (full-text article views including HTML views, PDF and ePub downloads, according to the available data) and Abstracts Views on Vision4Press platform.
Data correspond to usage on the plateform after 2015. The current usage metrics is available 48-96 hours after online publication and is updated daily on week days.
Initial download of the metrics may take a while.