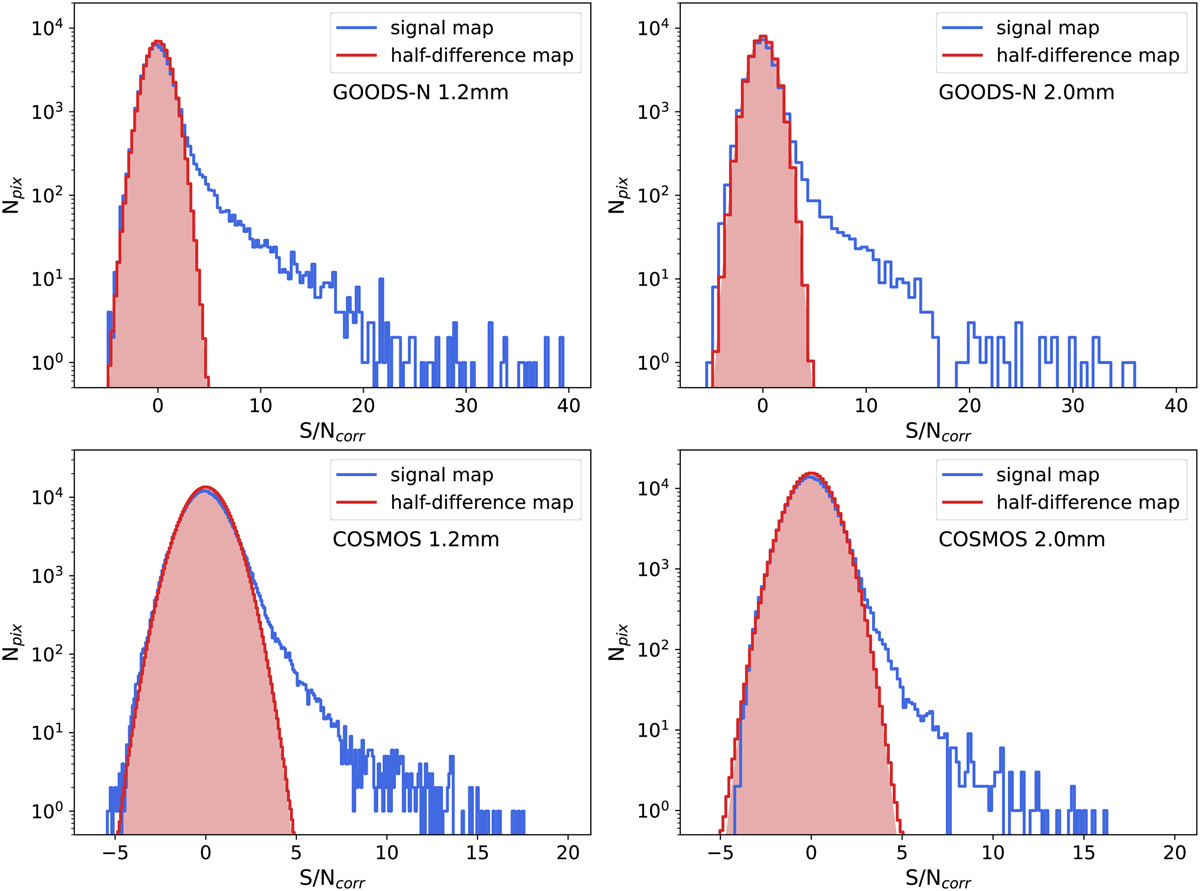
Fig. 3
Download original image
Pixel S/N distribution within the high-quality regions of the 1.2 and 2 mm maps shown in Figs. 1 and 2, as well as the average distribution of pixel S/N in 100 randomly generated half-difference maps for each field and waveband (see Sect. 2.2). The red-shaded region illustrates the best-fit normal distribution on the average histograms of the half-difference maps.
Current usage metrics show cumulative count of Article Views (full-text article views including HTML views, PDF and ePub downloads, according to the available data) and Abstracts Views on Vision4Press platform.
Data correspond to usage on the plateform after 2015. The current usage metrics is available 48-96 hours after online publication and is updated daily on week days.
Initial download of the metrics may take a while.