Fig. 1
Download original image
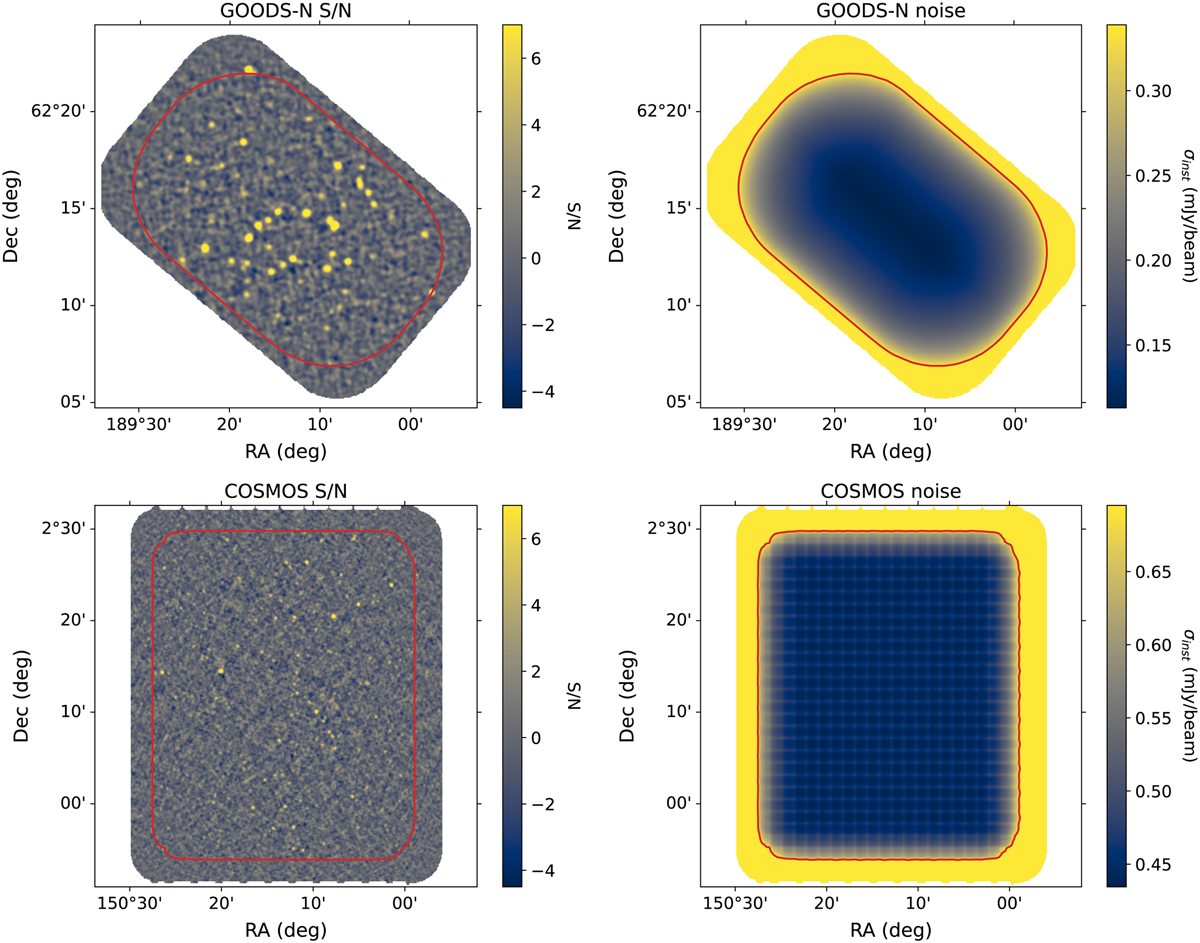
Maps of signal-to-noise ratio (left panels) and noise (σinst in mJy/beam, right panels) of the 1.2 mm N2CLS maps of the GOODS-N (upper panels) and COSMOS (lower panels) fields. The S/N maps and noise maps are matched filtered (see Sect. 2.3). The regions enclosed in the red contours (159 arcmin2 for GOODS-N and 1010 arcmin2 for COSMOS) have sufficiently low noise to be analyzed by our source-detection algorithm, and our catalogs and number counts are derived only in these areas (see Sects. 2.3 and 4).
Current usage metrics show cumulative count of Article Views (full-text article views including HTML views, PDF and ePub downloads, according to the available data) and Abstracts Views on Vision4Press platform.
Data correspond to usage on the plateform after 2015. The current usage metrics is available 48-96 hours after online publication and is updated daily on week days.
Initial download of the metrics may take a while.